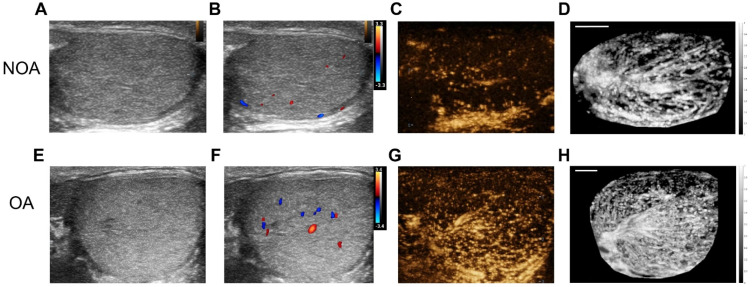
Figure 2.
Comparative ultrasonographic assessment of human testes in azoospermia patients. The top row shows images from a patient with non-obstructive azoospermia (NOA), and the bottom row depicts images from a patient with obstructive azoospermia (OA). From left to right: (A) & (E) B-mode ultrasound, (B) & (F) color Doppler flow imaging (CDFI), (C) & (G) contrast-enhanced ultrasound (CEUS), and (D) & (H) maximum intensity projection (MIP) images. To facilitate an intuitive comparison, the NOA images were horizontally mirrored. Scale bars = 5 mm.

