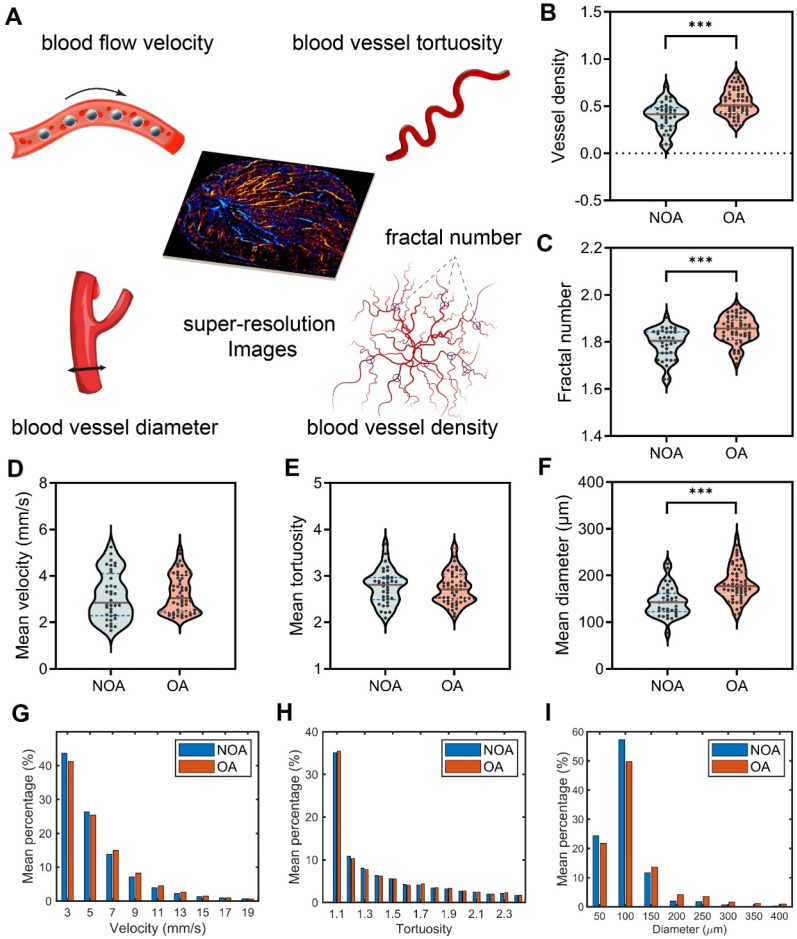
Figure 5.
Quantitative assessment of hemodynamics in testicular microcirculation of all patients in non-obstructive azoospermia (NOA) and obstructive azoospermia (OA) groups. (A) Five vascular-related quantitative parameters were extracted from the SR images of the testes. (B-F) Violin plots depicting the distribution of vessel density, fractal number, mean velocity, mean tortuosity, and mean diameter of testicular microvasculature. The dashed lines represent quartiles, the solid lines represent the median, and the dots represent the individual values of each sample. Asterisks indicate statistically significant difference in means (results calculated as shown in Table 1). *** indicates p < 0.001. (G-I) Histograms of the mean distribution of velocity, tortuosity, and diameter in the testes of all NOA and OA patients.

