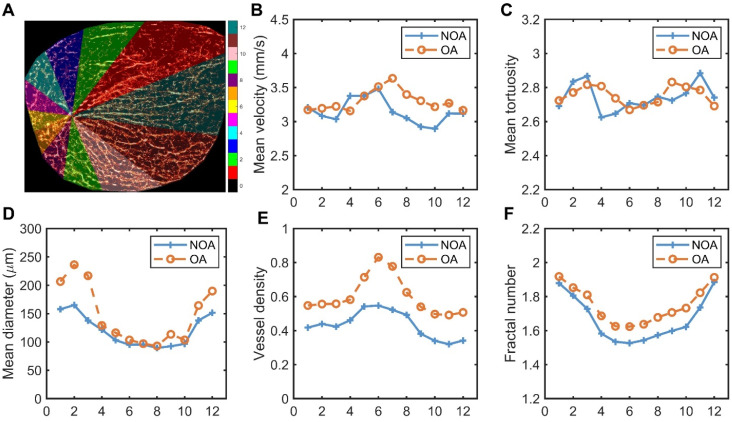
Figure 6.
Schematic diagram of testicular regional division and quantitative comparison of microvascular parameters in each region for all non-obstructive azoospermia (NOA) and obstructive azoospermia (OA) patients. (A) Segmented regions of a testis, with different colors representing various zones (1-12) used for analysis, and the scale indicating the corresponding regions. (B-F) Graphs showing mean velocity, mean tortuosity, mean diameter, vessel density, and fractal number in different regions for NOA and OA.

