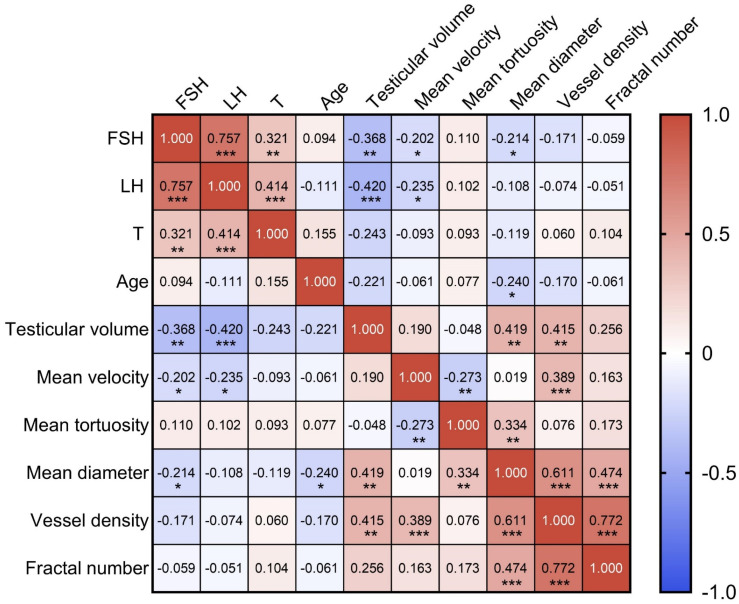
Figure 7.
Heatmap of Pearson correlation coefficient matrix representing the relationships among various parameters of spermatogenic functions and testicular microcirculation in azoospermia patients. Each cell displays the Pearson correlation coefficient between pairs of variables, where 1.0 indicates a perfect positive correlation, 0 indicates no correlation, and -1.0 indicates a perfect negative correlation. The colors range from red (positive correlation) to blue (negative correlation). FSH: follicle-stimulating hormone; LH: luteinizing hormone; T: testosterone. *** indicates p < 0.001, ** indicates p < 0.01, * indicates p < 0.05.

