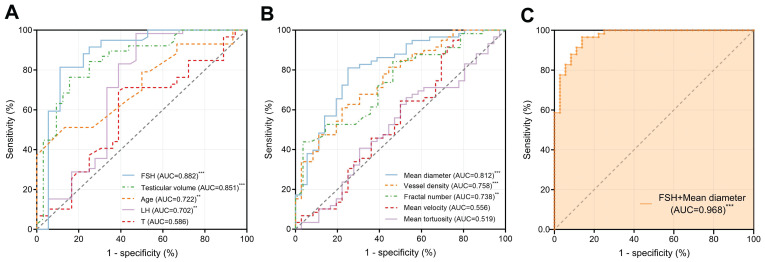
Figure 8.
Receiver Operating Characteristic (ROC) curves demonstrating the diagnostic performance of different parameters in distinguishing between NOA and OA. (A) Clinical parameters: FSH, testicular volume, age, LH, and T. (B) Ultrasound localization microscopy (ULM)-derived vascular parameters: mean diameter, vessel density, fractal number, mean tortuosity, and mean velocity. (C) A multiple logistic regression model combining FSH and mean diameter showed the highest accuracy, with an AUC of 0.968. FSH: follicle-stimulating hormone; LH: luteinizing hormone; T: testosterone; AUC: area under the curve. *** indicates p < 0.001, ** indicates p < 0.01.

