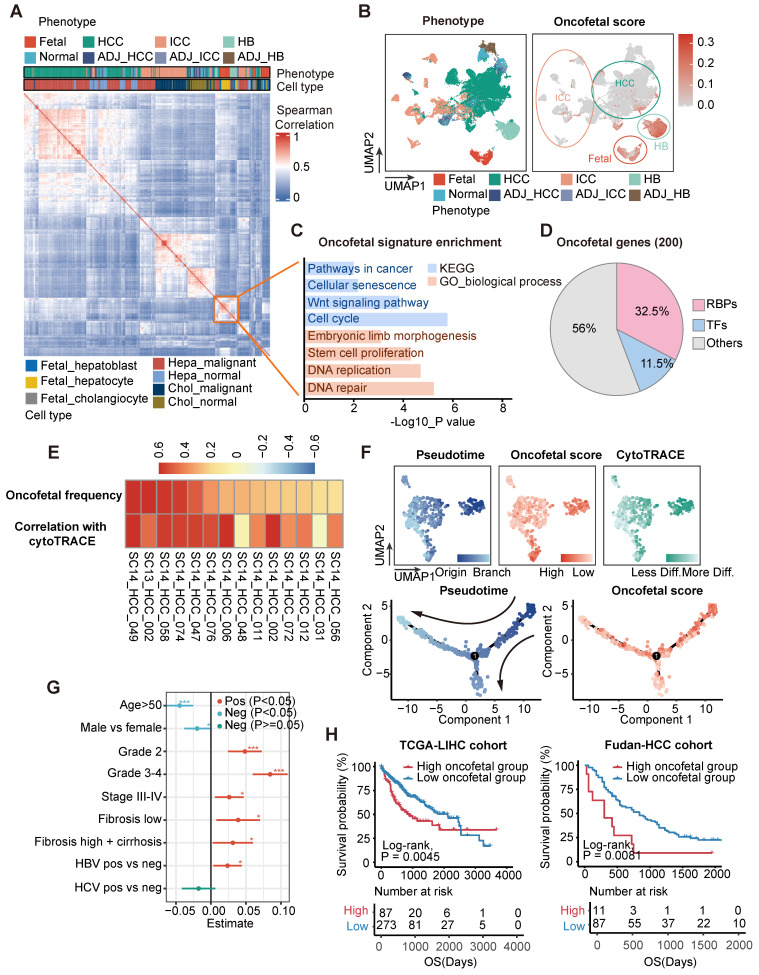
Figure 1.
Deciphering the oncofetal features of liver cancer and enriching them with abundant RNA-binding proteins. (A) Heatmap demonstrating pair-wise correlations among epithelial pseudobulks. The yellow box represented the module formed by the co-clustering of epithelial cells from fetal liver, HB and HCC which denoted similar transcriptional pattern shared among these cells. (B) UMAP layout of all epithelial cells colored by liver phenotype (Left panel) and oncofetal score (Right panel). Oncofetal scores below 95% percent of normal cells were reset as zero. Color scheme of liver phenotype was the same as that in (A). (C) KEGG and gene ontology analysis of 200 oncofetal related genes. (D) The proportion of RBPs and TFs genes among the 200 oncofetal related genes. (E) Heatmap showing the positive correlation between oncofetal scores and cell developmental potential in the individual HCC samples with higher abundance of fetal-like cells. (F) UMAP layout and cell differentiation trajectory inferred for SC14_HCC_058 displaying the substantial agreement between cells with higher oncofetal scores and originating cells characterized by higher CytoTRACE scores and earlier pseudotime. (G) Correlation between oncofetal scores and clinicopathological variables in HCC samples of GepLiver bulk meta-cohort. Linear regression was performed for each parameter with dataset included as covariate. Lines represented 95% confidence intervals. (H) Kaplan-Meier plots demonstrating the association between oncofetal score and worse survival outcome in TCGA-LIHC (Left panel) and Fudan-HCC cohort (Right panel). Optimal cutpoint defined by the surv_cutpoint function of the survminer R package to delineate the most significant survival relationships for the oncofetal score was employed. For the TCGA-HCC cohort, the cut-off value was set at 1.04, defining the top 24% of HCCs as oncofetal high tumor group (n = 87) and 76% as low group (n = 273). For the Fudan-HCC cohort, the cut-off value was set at 1.87, defining the top 11% of HCCs as oncofetal high tumor group (n = 11) and 89% as low group (n = 87). *P<0.05, ***P < 0.001.

