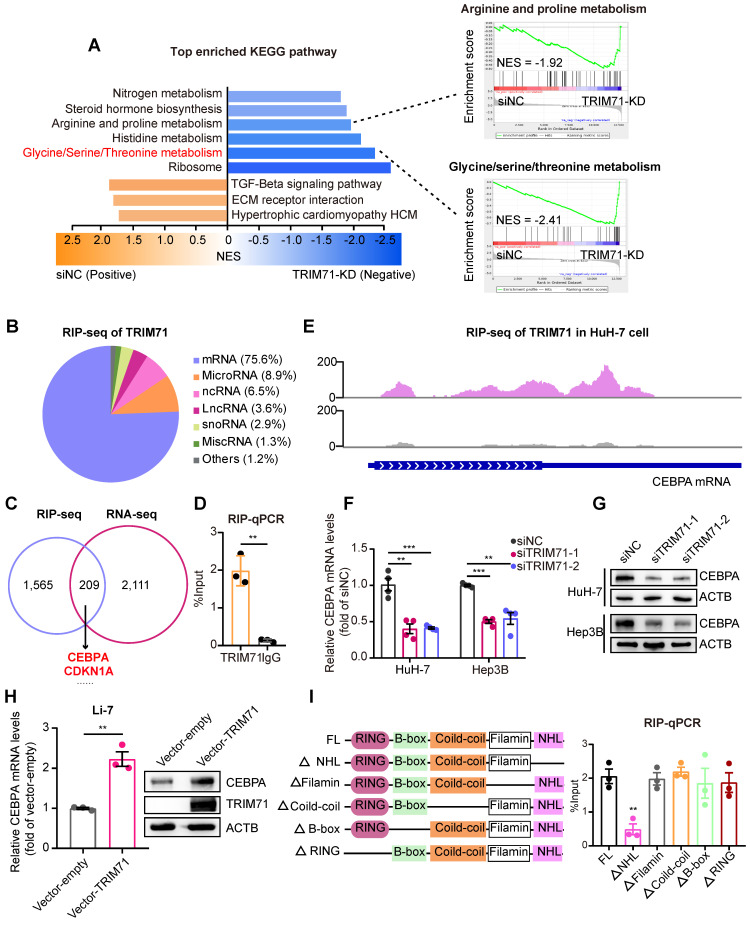
Figure 4.
TRIM71 controls metabolic pathways and CEBPA mRNA levels. (A) KEGG pathway enrichment analysis of differentially expressed genes in HuH-7 cells transfected with siNC or siRNAs targeting TRIM71 (Left). GSEA showing down-regulated pathways after TRIM71 knockdown including glycine/serine/threonine metabolism pathway and arginine and proline metabolism (Right). (B) Pie chart showing transcript types binding to TRIM71 by RIP-seq analysis of HuH-7 cells. (C) Venn diagram showing the overlap between the differentially expressed transcripts in TRIM71-KD cells and transcripts bound by TRIM71. (D) RIP-qPCR analysis showing the dramatic enrichment of TRIM71 on CEBPA mRNA. (E) The binding peaks of TRIM71 on CEBPA mRNA in HuH-7 cells. (F) The CEBPA mRNA levels in HuH-7 and Hep3B cells transfected with siNC or siTRIM71 siRNAs. (G) Immunoblot analysis of CEBPA protein levels in HuH-7 and Hep3B cells transfected with siNC or siTRIM71 siRNAs. (H) The CEBPA mRNA levels and protein levels in Li-7 cells with infected with control or TRIM71 overexpression lentiviruses. (I) Schematic description of TRIM71 mutants (left). RIP-qPCR analysis showing enrichment of NHL domain of TRIM71 on CEBPA mRNA (right). Values represent the mean ± SEM. **P < 0.01, ***P < 0.001.

