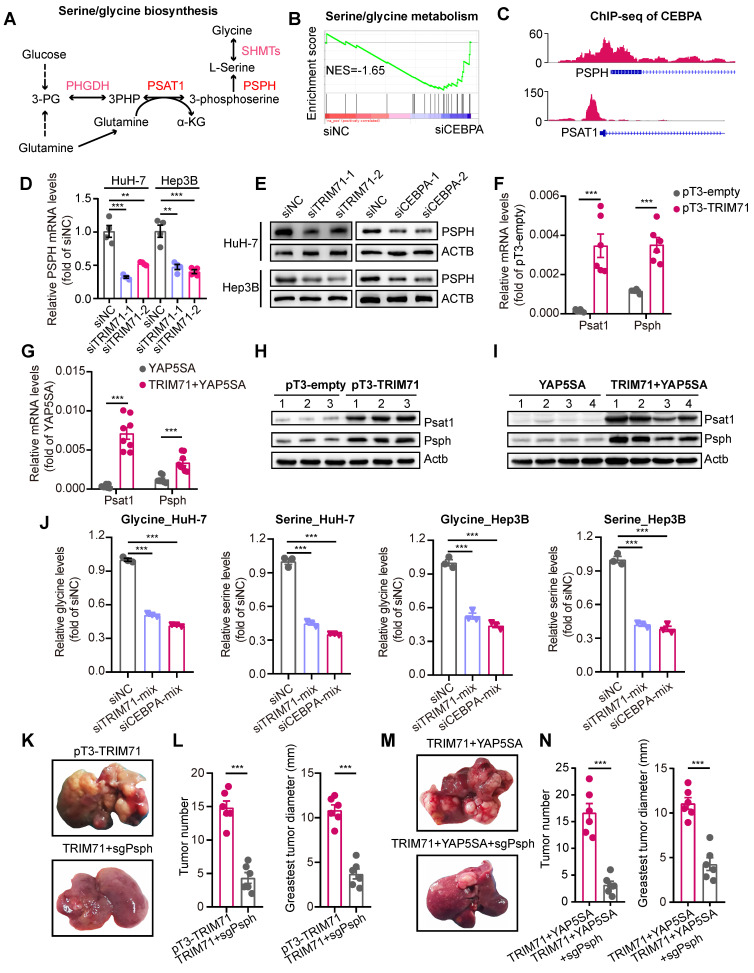
Figure 6.
“TRIM71-CEBPA” axis controls serine and glycine biosynthesis in liver cancer cells. (A) Schematic diagram depicting serine and glycine biosynthesis pathways. (B) GSEA results showing the enrichment of serine/glycine biosynthesis pathway after CEBPA knockdown. (C) The binding peaks of CEBPA in PSPH and PSAT1 promoter regions. (D) The PSPH mRNA levels in HuH-7 and Hep3B cells transfected with siNC or siTRIM71 mixed siRNAs. (E) Immunoblot analysis of PSPH protein levels in HuH-7 and Hep3B cells transfected with siNC, siTRIM71 or siCEBPA mixed siRNAs. (F) The Psph and Psat1 mRNA levels in mouse liver cancer tissues of pT3-empty or pT3-TRIM71 models. (G) The Psph and Psat1 mRNA levels in mouse liver cancer tissues of YAP5SA or YAP5SA + TRIM71 models. (H) Immunoblot showing the Psph and Psat1 protein levels in mouse liver cancer tissues of pT3-empty or pT3-TRIM71 models. (I) Immunoblot showing the Psph and Psat1 protein levels in mouse liver cancer tissues of YAP5SA or YAP5SA + TRIM71 models. (J) The intracellular serine and glycine levels in HuH-7 and Hep3B cells transfected with siNC, siTRIM71 or siCEBPA mixed siRNAs. (K) Representative images of tumors dissected from liver tumor mouse models of pT3-TRIM71 or pT3-TRIM71combined with knocking down of Psph. (L) Tumor number and greatest tumor diameter in liver tumor mouse models of pT3-TRIM71 or pT3-TRIM71 combined with knocking down of Psph. (M) Representative images of tumors dissected from liver tumor mouse models of TRIM71 + YAP5SA or TRIM71 + YAP5SA combined with knocking down of Psph. (N) Tumor number and greatest tumor diameter in liver tumor mouse models of TRIM71 + YAP5SA or TRIM71 + YAP5SA combined with knocking down of Psph. Values represent the mean ± SEM. **P < 0.01, ***P < 0.001.

