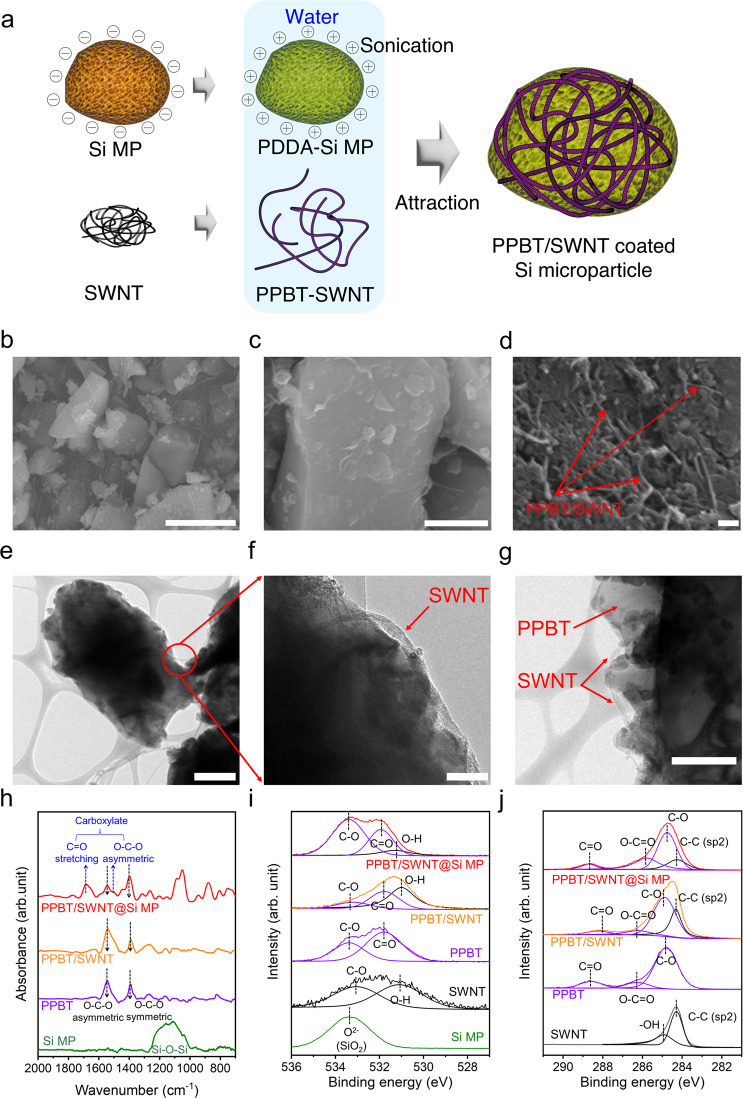
Figure 1.
(a) Schematic images of fabrication steps for PPBT/SWNT@Si MPs. (b–d) Scanning electron microscope (SEM) images of PPBT/SWNT@Si MPs (scale bar: b. 5 μm, c. 1 μm, d. 100 nm). (e–g) Transmission electron microscopy images of PPBT/SWNT@Si MPs (scale bar: e. 500 nm, f. 100 nm, g. 500 nm). (h) Fourier transform infrared (FT-IR) spectra of Si MPs, PPBT, PPBT/SWNT, and PPBT/SWNT @Si MPs. (i) O 1s spectra of Si MPs, SWNT, PPBT, PPBT/SWNT, and PPBT/SWNT@Si MPs. (j) C 1s spectra of SWNT, PPBT, PPBT/SWNT, and PPBT/SWNT@Si MPs.

