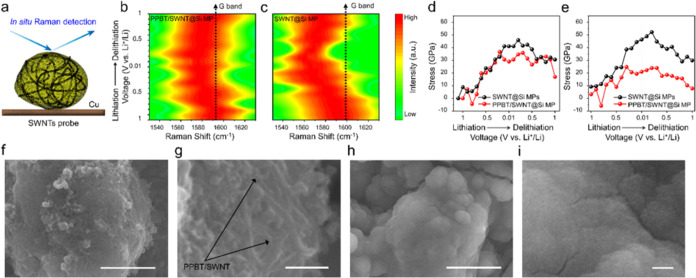
Figure 4.
(a) Schematic image of stress monitoring using Raman spectroscopy. The G-band positions in the in situ Raman spectra for (b) PPBT/SWNT@Si MP and (c) SWNT@Si MP during cycling. The G-band shifts and corresponding strain for the SWNTs in the PPBT/SWNT@Si MP and SWNT@Si MP anodes during (d) the initial and (e) the 10th cycle. SEM images of PPBT/SWNT@ Si MP anodes (f, g) and SWNT@Si MP anodes (h, i) after in situ Raman analysis. (Scale bar: f, h, 2 μm; g, i, 200 nm).

