Figure 2.
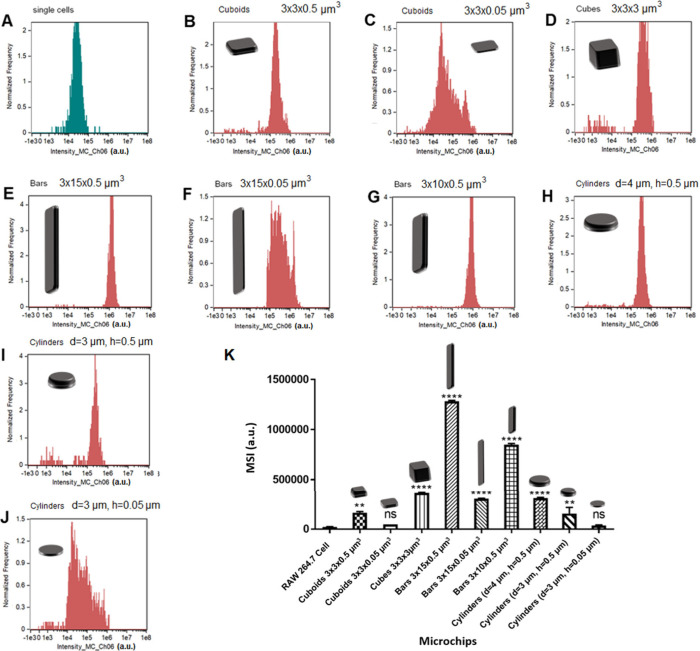
Scattering intensity histograms of RAW 264.7 cells and each particle shape at the same initial concentrations. A) RAW 264.7 cells, B) cuboids 3 × 3 × 0.5 μm3, C) cuboids 3 × 3 × 0.05 μm3, D) cubes 3 × 3 × 3 μm3, E) Bars 3 × 15 × 0.5 μm3, F) Bars 3 × 15 × 0.05 μm3, G) Bars 3 × 10 × 0.5 μm3, H) cylinders (diameter (d) = 4 μm, height (h) = 0.5 μm), I) cylinders (d = 3 μm, h = 0.5 μm), J) cylinders (d = 3 μm, h = 0.05 μm). K) Summary of median scattering intensity (MSI) values for RAW 264.7 cells and each particle shape. A) Particle MSI values compared with RAW 264.7 cells. * indicates a statistically significant difference between particle scattering and RAW 264.7 cell scattering as analyzed by one-way ANOVA with Dunnet’s multiple comparisons (**p < 0.01, ****p < 0.0001, ns = not significant).

