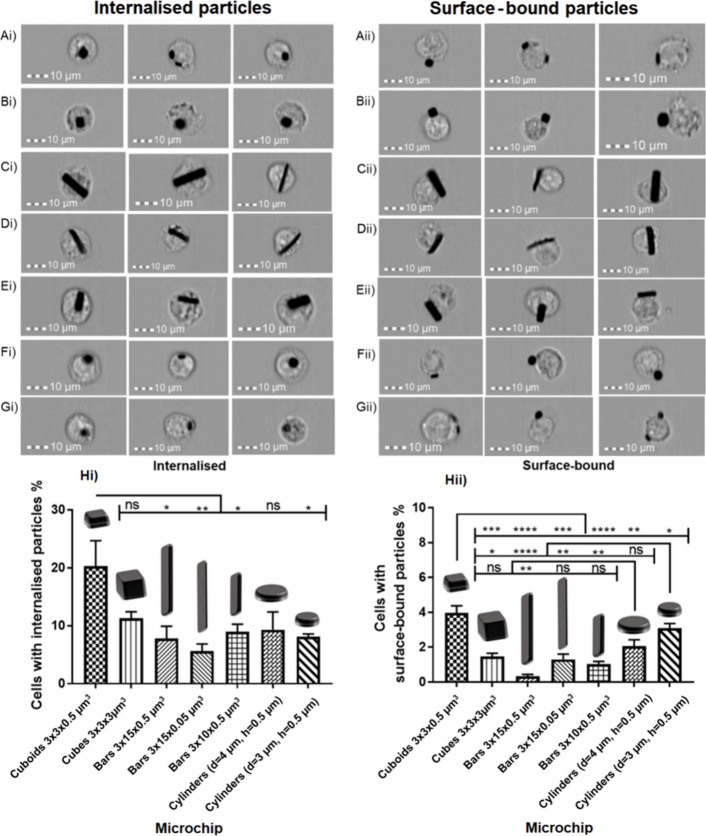
Figure 4.
Cell images from the imaging flow cytometry of cells with internal and external microchips. A) Cuboids (3 × 3 × 0.5 μm3), B) Cubes (3 × 3 × 3 μm3), C) Bars (3 × 15 × 0.5 μm3), D) Bars (3 × 15 × 0.05 μm3), E) Bars (3 × 10 × 0.5 μm3), F) Cylinders (d = 4 μm h = 0.5 μm), G) Cylinders (d = 3 μm h = 0.5 μm). The percentage of cells with Hi) internalized microchips and Hii) surface-bound microchips. Statistical differences analyzed by one-way ANOVA with Tukey’s multiple comparisons test (* p < 0.05, ** p < 0.01, *** p < 0.001, **** p < 0.0001). n = 1, N = 3 ± SEM.

