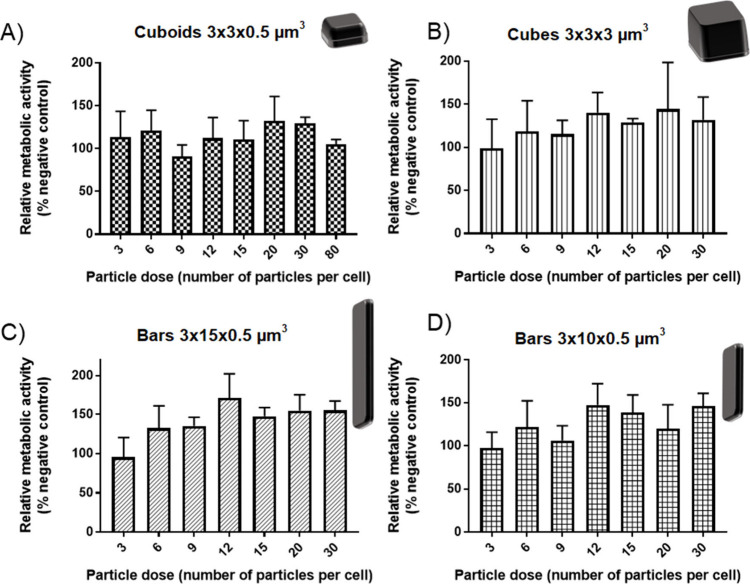
Figure 5.
Effect of increasing the polysilicon particle dose on RAW 264.7 metabolic activity. A) Cuboids (3 × 3 × 0.5 μm3), B) Cubes (3 × 3 × 3 μm3), C) Bars (3 × 15 × 0.5 μm3), D) Bars (3 × 10 × 0.5 μm3). Relative metabolic activity was calculated with respect to cells treated with 1% HEPES in HBSS (positive control) and cells treated with 0.1% Triton X-100 (negative control). Data are expressed as a mean ± SD (n = 3).

