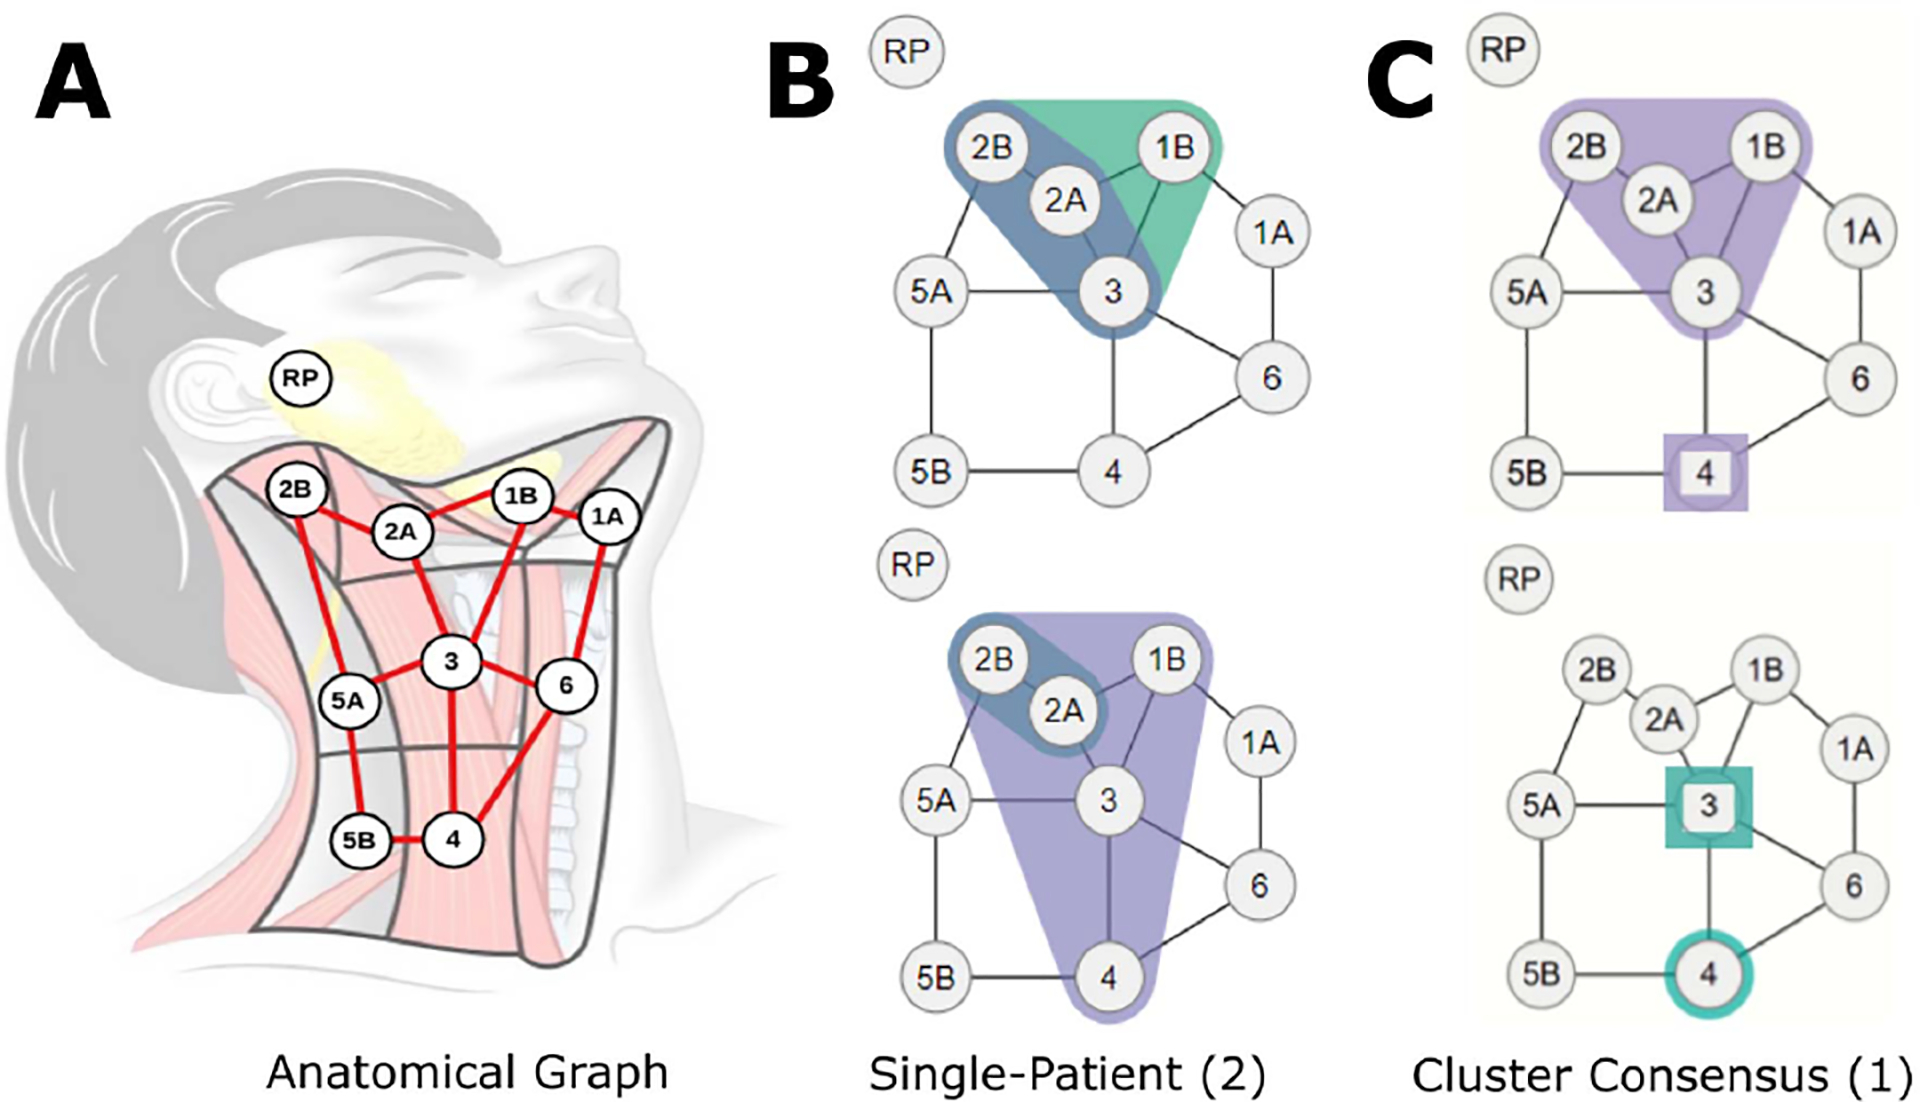
Figure 1:

(A) Lymph nodes overlaid over a diagram of the neck. (B) Example graphs of diseased nodes for 2 individual patients (datapoint representation). (C) Example consensus graph for 1 cluster (cluster representation). The top-right graph shows disease spread with 66+% of patients on the right nodes in 1B, 2A, 2B, and 3, and disease in 1–33% of patients in right node 4. The bottom-right graph similarly indicates involvement of >66% and <33% of patients in left nodes 4 and 3, respectively.
