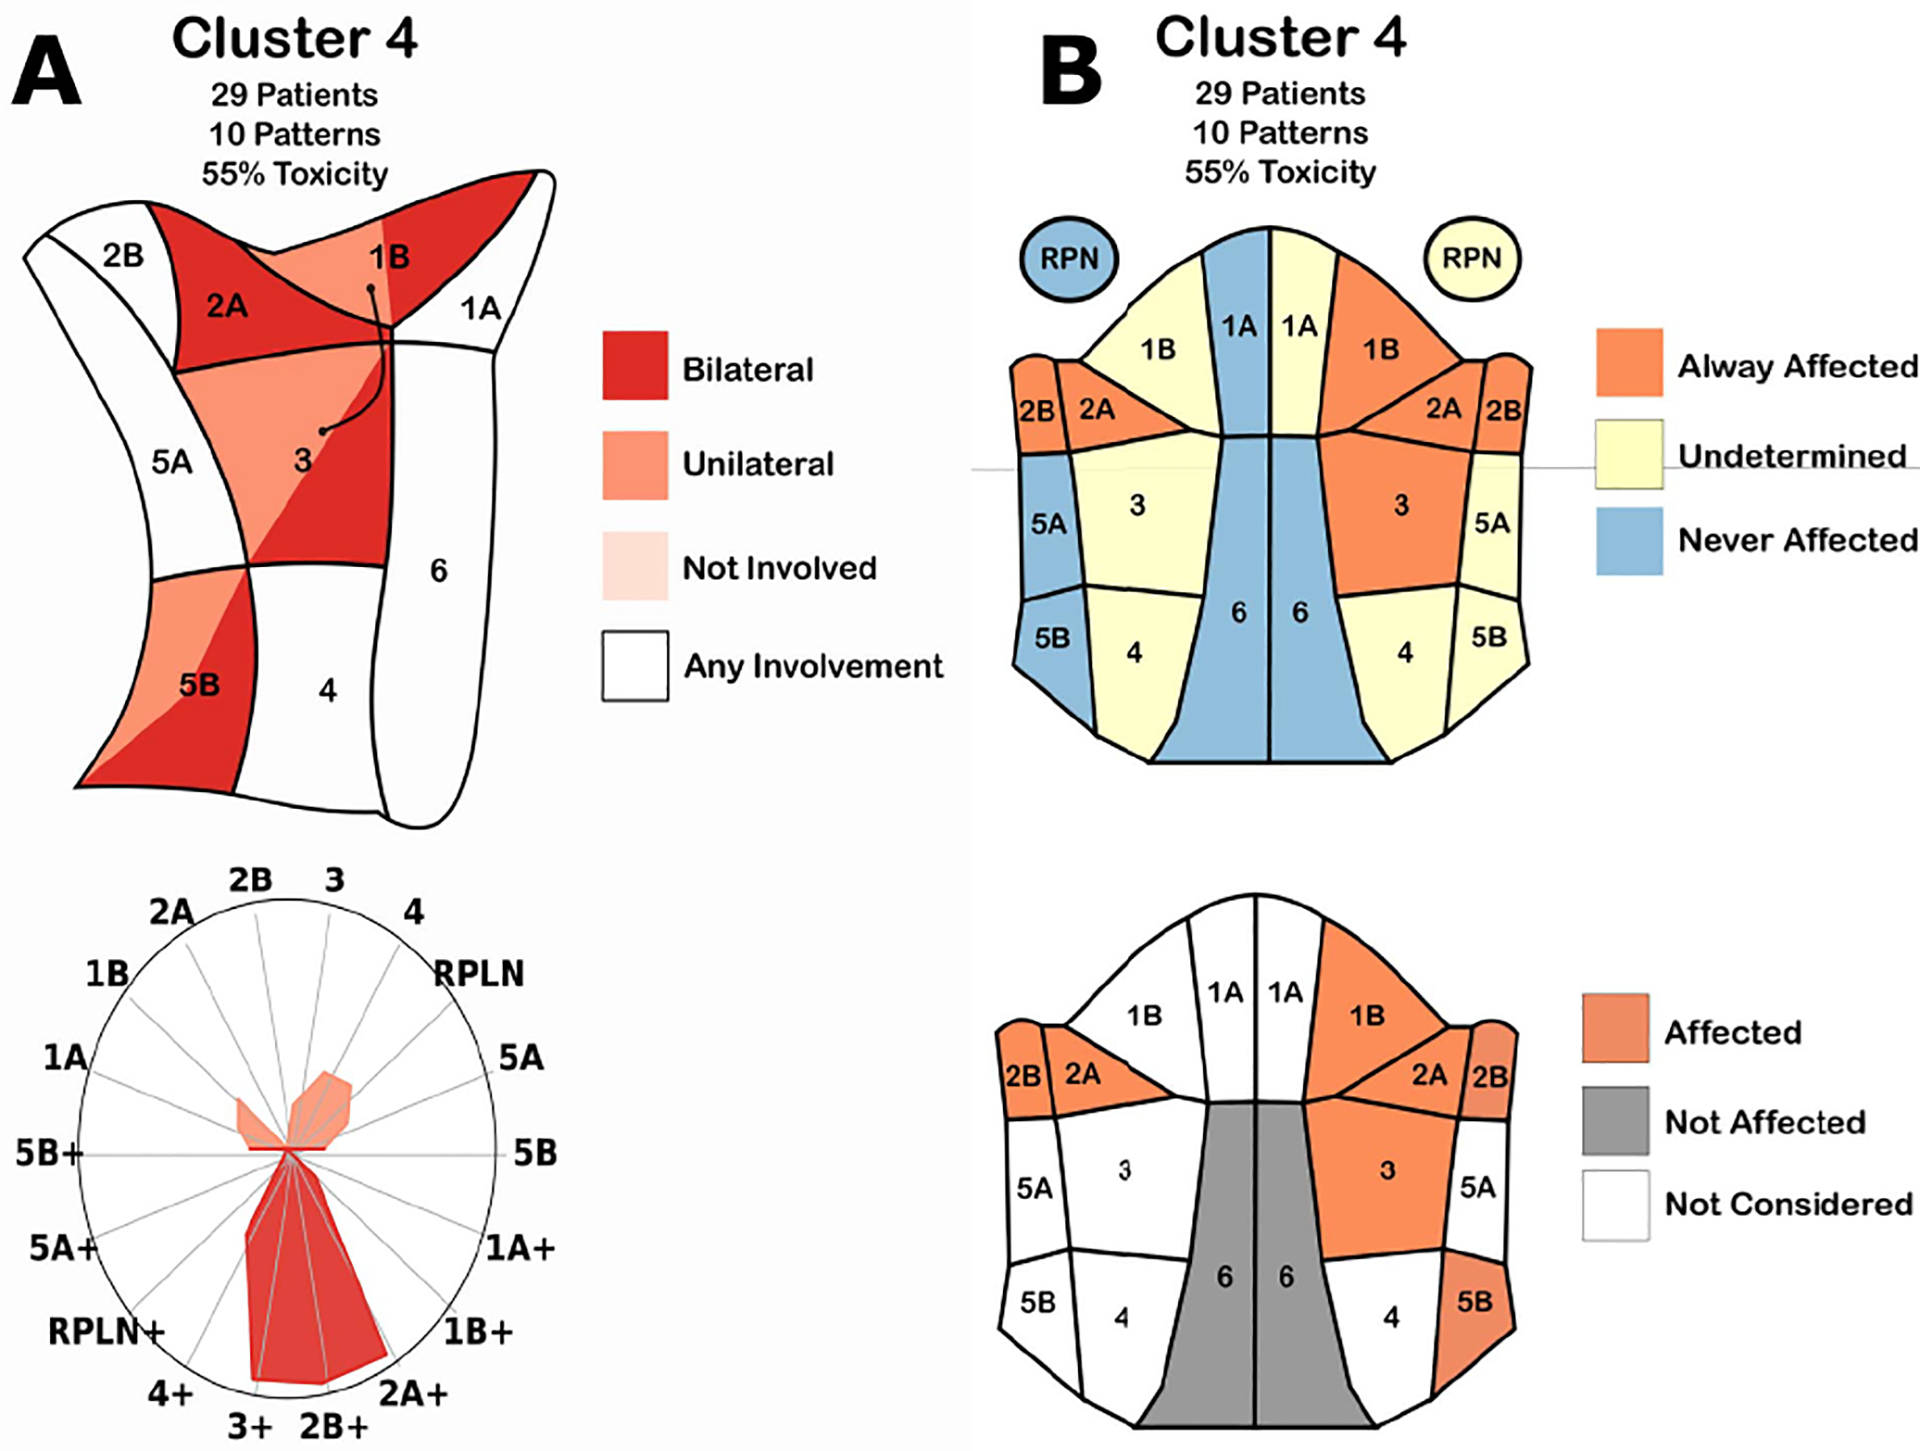
Figure 3:

(A) Cluster conditionals. (Top-left) Map of the regions in the neck. Color indicates when the decision tree classified a patient into the cluster based on if the region had no disease (pale red), tumors in one side of the head (red), both sides of the head (dark red), or a combination of two options. (Bottom-left) Radar chart showing the percentage of patients in the cluster with nodal tumors in a given region. Color indicates the presence of tumors in exactly one (pale red) or two (dark red) sides of the head. (B) Second iteration of cluster conditionals. (Top-right) Membership diagram showing the regions in the head. Color indicates when all (red), a subset of (yellow), or none of (blue) the patients in a cluster had nodal tumors in a region. (Bottom-right) Decision-tree based diagram. Colors indicate when a decision tree classified a patient into that cluster.
