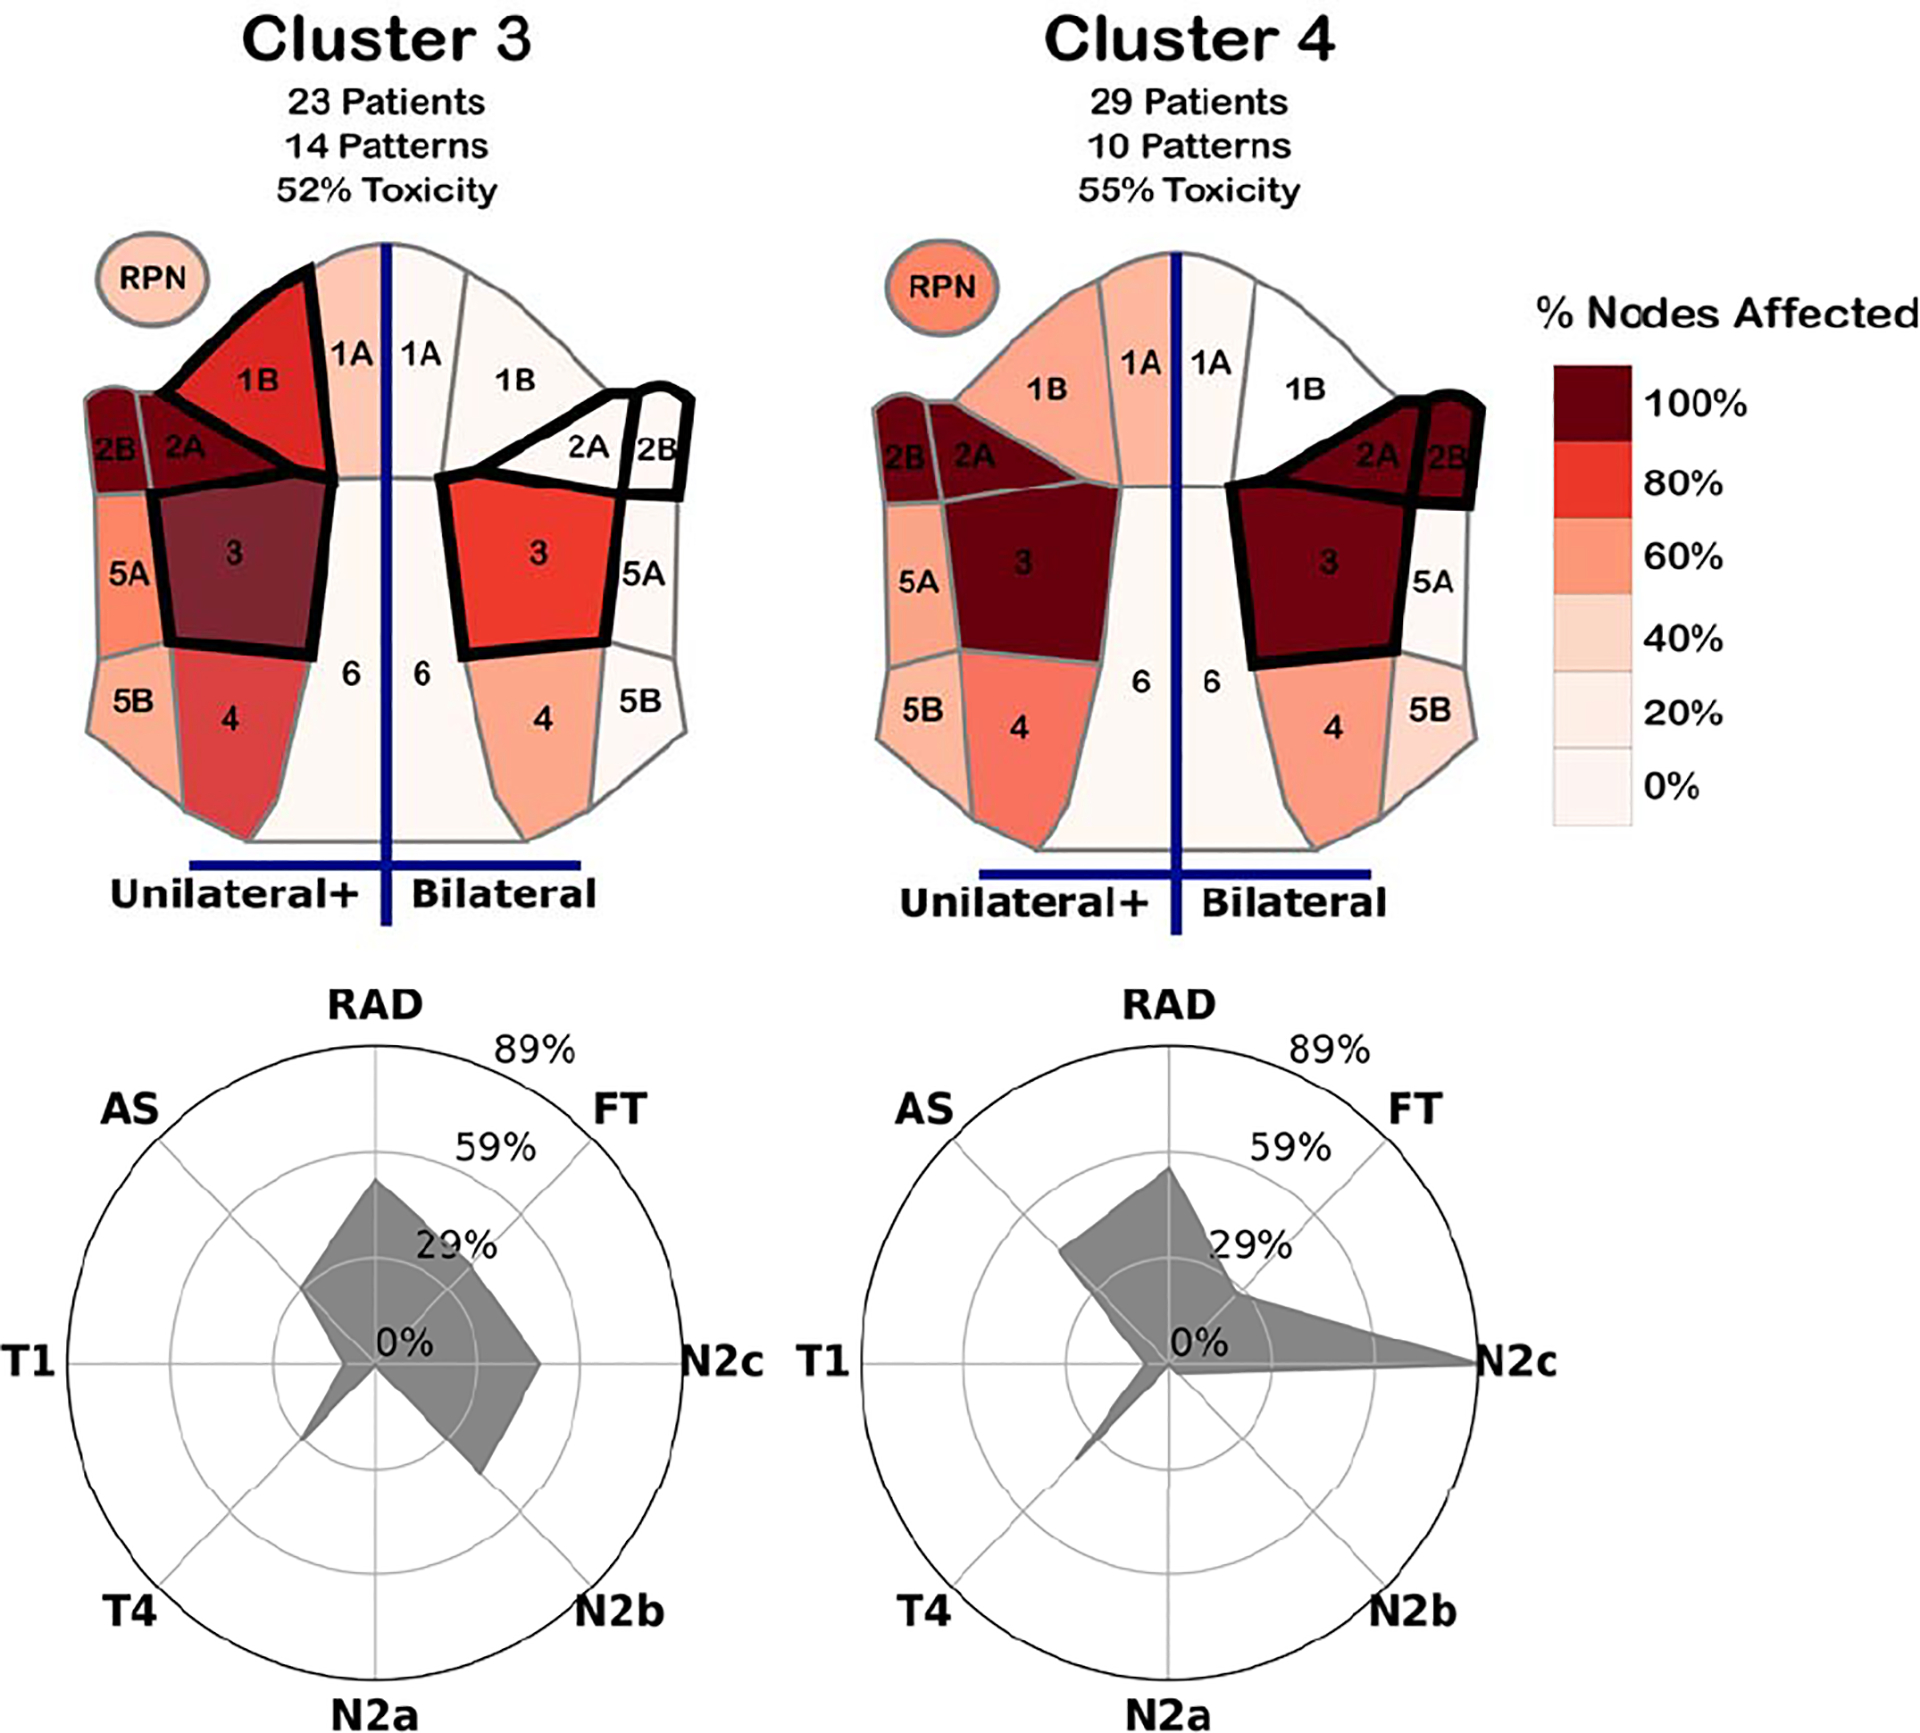
Figure 4:

Designs for two high-risk cluster conditionals. (Top) Spatial heatmaps showing the portion of patients with nodal tumors in each region for at least one (left) or both (right) sides of the head. Regions most informative in determining cluster membership are outlined in a thick dark border. (Bottom) Radar charts showing the percentage of patients within the cluster with a given toxicity outcome (FT/RAD/AS), and those within an existing risk-staging group (T1/T4/N2a/N2b/N2c).
