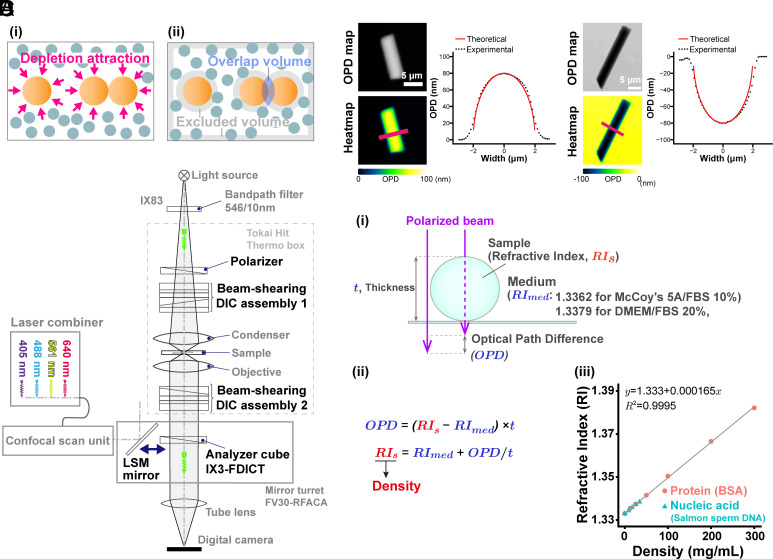
Fig. 1.
Schematics of the depletion attraction/macromolecular crowding effect, OI-DIC microscopy, and density quantification. (A, i) Many small spheres (blue-gray) representing soluble macromolecules bombard three large spheres (orange, representing chromatin) from all sides (arrows). When two large spheres come into contact (Right), the small ones exert a force equivalent to their osmotic pressure on opposite sides of the two large ones to keep them together (depletion attraction/macromolecular crowding effect). (ii) The shaded regions in this alternative view show regions inaccessible to the centers of mass of the small spheres (excluded volumes). When two large spheres contact each other, their excluded volumes overlap and increase the volume accessible to the small spheres. Large sphere aggregation is then favored by an increase in the entropy of the system. (B) Optical schematic of the confocal laser scanning microscope Olympus FV3000, equipped with the OI-DIC module. Details of the microcopy system are described under SI Appendix, Materials and Methods. (C) Validation of density imaging by OI-DIC microscopy using known glass rods and mineral oils. The RI of the glass rods was 1.56, and those of the oils were 1.54 (Left) and 1.58 (Right). The theoretical and experimental values are equivalent, ensuring the accuracy of our RI quantification. (Scale bar, 5 μm.) (D, i) A procedure for estimating the RI of sample (depicted as a sphere). Our OI-DIC microscopy can computationally quantify optical path differences (OPDs) at each spatial point. (ii) The formula to calculate RI of a sample. (iii) The calibration curve of RI versus the density of standard solutions for protein or nucleic acid. RI = 1.333 + 1.65 × 10⁻⁴ × C (RI, the refractive index; C, the concentration of the proteins or nucleic acids [mg/mL]).

