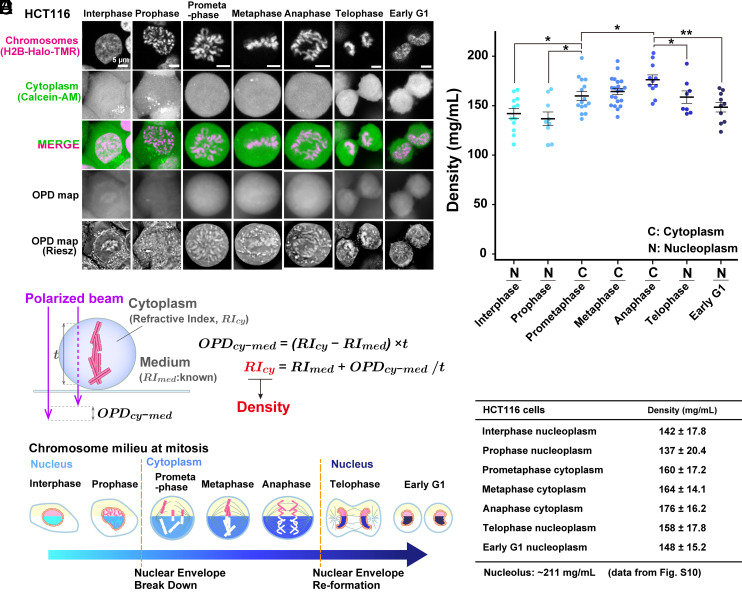
Fig. 2.
Density imaging of live human HCT116 cells using OI-DIC microscopy. (A) Confocal images, OPD maps, and Riesz images. Image intensities are not presented on the same scale for better visualization. (B) Schematic of how the RI of the cytoplasm (RIcy) is estimated. The RIcy can be calculated using the formula shown based on the OPD measured by OI-DIC, the RI of medium (RImed) measured by the refractometer, and thickness (t) values. (C) Schematic of chromatin/chromosome milieu during mitosis. The measured regions in the cells are marked in cyan, blue, or navy. (D) Total molecular densities of chromosome milieu in live HCT116 cells. Each dot represents the average of the estimated total density at several points within a single cell, where no apparent structure is obvious in the Riesz image (SI Appendix, Fig. S2). Mean ± SE are shown. Cell numbers are N = 12 (interphase), 9 (prophase), 15 (prometaphase), 21 (metaphase), 11 (anaphase), 8 (telophase), and 10 (early G1). *P < 0.05 by the two-sided unpaired t test for interphase nucleoplasm vs. prometaphase cytoplasm (P = 0.015), prophase nucleoplasm vs. prometaphase cytoplasm (P = 0.013), prometaphase cytoplasm vs. anaphase cytoplasm (P = 0.021), anaphase cytoplasm vs. telophase nucleoplasm (P = 0.044) and **P < 0.001 for anaphase cytoplasm vs. early G1 nucleoplasm (P = 6.9 × 10⁻⁴). (E) Mean ± SD of total molecular densities at each phase.

