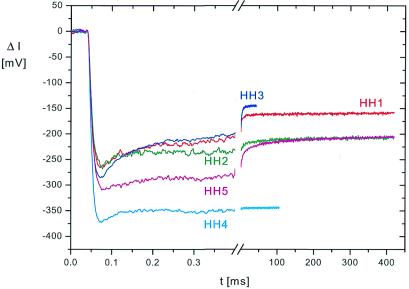
Figure 2.
Fluorescence detected relaxation curves (change of fluorescence intensity ΔI as a function of time t) for hammerhead ribozymes HH1–HH5 induced by temperature jumps from 2.0 to 10.6°C in buffer B. The data are shown with a pretrigger recording period of 40 µs, i.e. the time before application of joule heating. The time constant of the initial decrease of the fluorescence is determined by the heating time of 8.25 µs and the detector risetime of 5.4 µs (adjusted in these experiments to a relatively slow detection mode).

