
Figure 1.
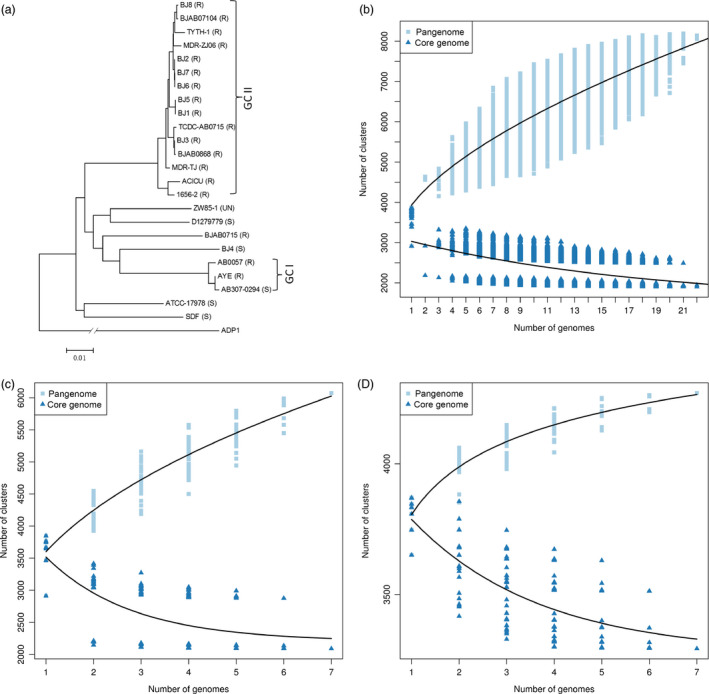
The effect of inappropriate sample choice on pangenome prediction. Relationships between all individuals (a). Pangenome estimation based on all individuals (b). Pangenome estimation based on a sample of seven diverse individuals (BJ3, BJ4, BJ8, ACICU, BJAB0715, SDF,ZW85_1). The shape of the pangenome curve is similar to the one based on all the individuals, suggesting an open pangenome. The size of core genome is similar to the core genome based on all the individuals (c). Pangenome estimation based on a sample of seven closely related individuals (BJ1, BJ2, BJ3, BJ5, BJ6, BJ7, BJ8). The shape of the pangenome curve is different than in b and c, suggesting a closed pangenome. The size of core genome is larger than in b and c (d). Panel a adapted and the data used from (Liu et al., 2014)