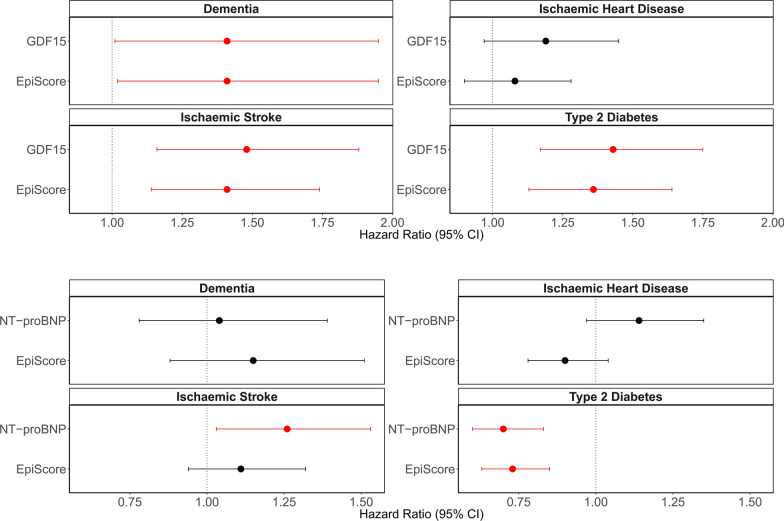
Fig. 3.
Comparison of EpiScores versus measured protein equivalents in fully adjusted associations with incident diseases in the Generation Scotland test sample (N ≥ 2808). For each disease, the protein-disease association is plotted, with the equivalent protein EpiScore-disease association shown directly beneath it for comparison. Hazard ratios are plotted per 1 SD increase in the rank-based inverse normalised levels of each marker. Nine associations (red) had FDR P < 0.05 in basic and P < 0.05 in fully adjusted Cox proportional hazards mixed effects models in the test samples. Fully adjusted models adjusted for age, sex, relatedness and common lifestyle risk factors (smoking, alcohol intake, BMI, social deprivation and years of education). Associations that were non-significant (P > 0.05 in fully adjusted models) are shown in black

