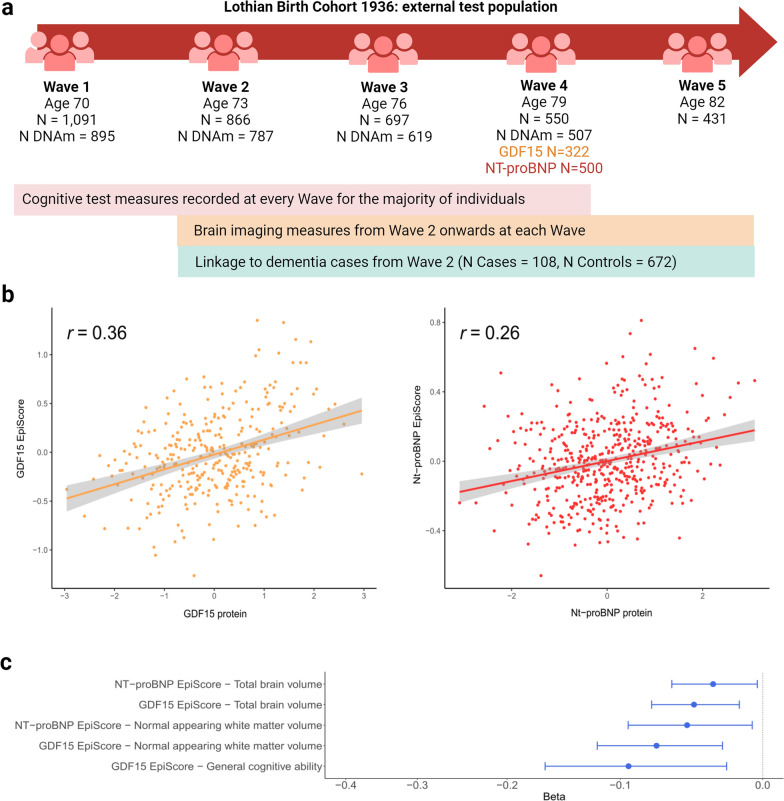
Fig. 4.
External assessment of the GDF15 and NT-proBNP EpiScores in LBC1936. a Measurements available across the Waves of the LBC1936 external population. b Correlation plots between measured protein levels and GDF15 (orange) and NT-proBNP (red) EpiScores in the LBC1936 Wave 4 external test set (NGDF = 322, NNT-proBNP = 500). Pearson correlation coefficients are annotated in each instance. c, Standardised beta coefficients derived from structural equation models (SEMs) between EpiScore levels at LBC1936 Wave 1 (N = 895 with DNAm, N = 1091 total) and cross-sectional measures of brain health traits that had FDR P < 0.05 in basic (age and sex adjusted) models and P < 0.05 after adjustment for further lifestyle covariates. All associations had a negative beta coefficient (blue). Twenty EpiScore-trait associations were tested in total: 10 cross-sectionally and 10 assessing longitudinal change in brain traits

