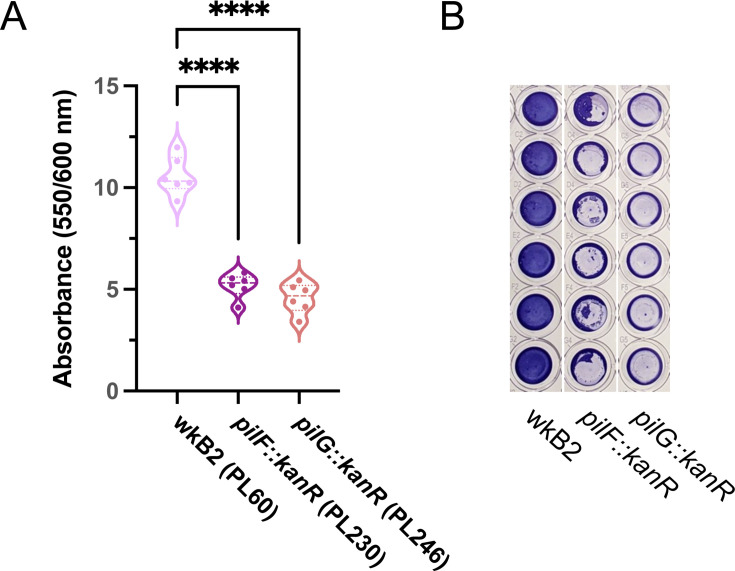
Fig 3.
Phenotypic validation: Knockout of genes encoding adhesion proteins results in biofilm formation defects. (A) Plot of OD550/OD600 to quantify biofilm formation normalized to cell growth for biofilm knockout strains. Compared to WT, pilF::kanR and pilG::kanR have decreased biofilm formation relative to growth. Thick dotted line = median; thin dotted line = quartiles. N = 6 for each condition. ****: P < 0.0001, as determined by one-way parametric ANOVA with Dunnett’s multiple comparison test. (B) Image of crystal violet-stained 96-well plate columns demonstrating pilF::kanR and pilG::kanR mutants have reduced biofilm formation as compared to wkB2.

