Fig 4.
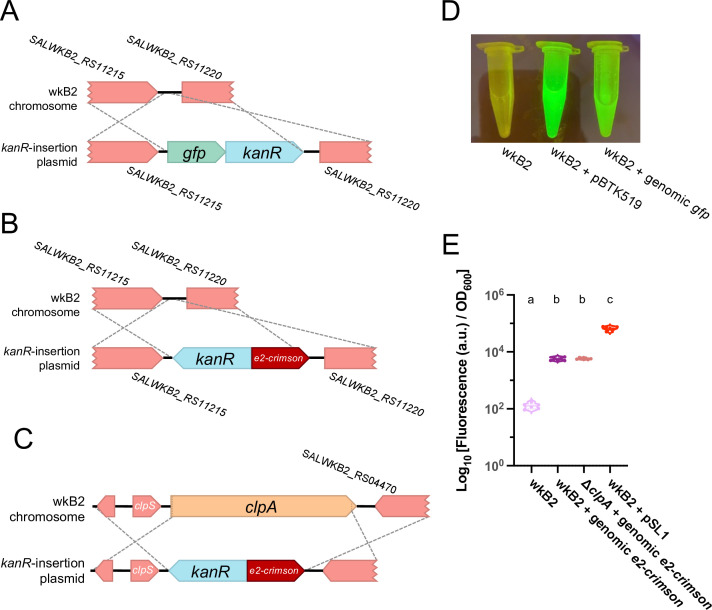
Fluorescent protein-coding genes can be inserted into the S. alvi genome. (A) Gene insertion map depicting insertion of a gfp + kanR cassette into a non-essential, intergenic region of the genome. (B) Gene insertion map depicting insertion of an e2-crimson + kanR cassette into a non-essential, intergenic region of the genome. (C) Gene insertion map depicting deletion of the clpA gene via replacement insertion of an e2-crimson + kanR cassette. (D) Image of wkB2, wkB2 + pBTK519 (positive control), and wkB2 + genomic gfp cells in front of a blue light transilluminator (470 nm), demonstrating successful insertion of gfp as evidenced by green fluorescence that is not observed in WT cells. (E) Plot of E2-Crimson fluorescence, demonstrating that wkB2 + genomic e2-crimson cell pellets resuspended in PBS display significantly increased red fluorescence compared to wkB2 and approximately one-tenth the fluorescence of wkB2 + pSL1, which contains a multicopy plasmid expressing e2-crimson. Log10 of OD611 ex, 646 em/OD600 is shown for cell cultures that were pelleted, resuspended in PBS, and read in a 96-well plate. Solid line = median; thin dotted line = quartiles. N = 6 for each condition. Dissimilar letters above each group indicate a significant difference in means (P < 0.0001, as determined by one-way parametric ANOVA with Tukey’s multiple comparison test).

