Figure 1.
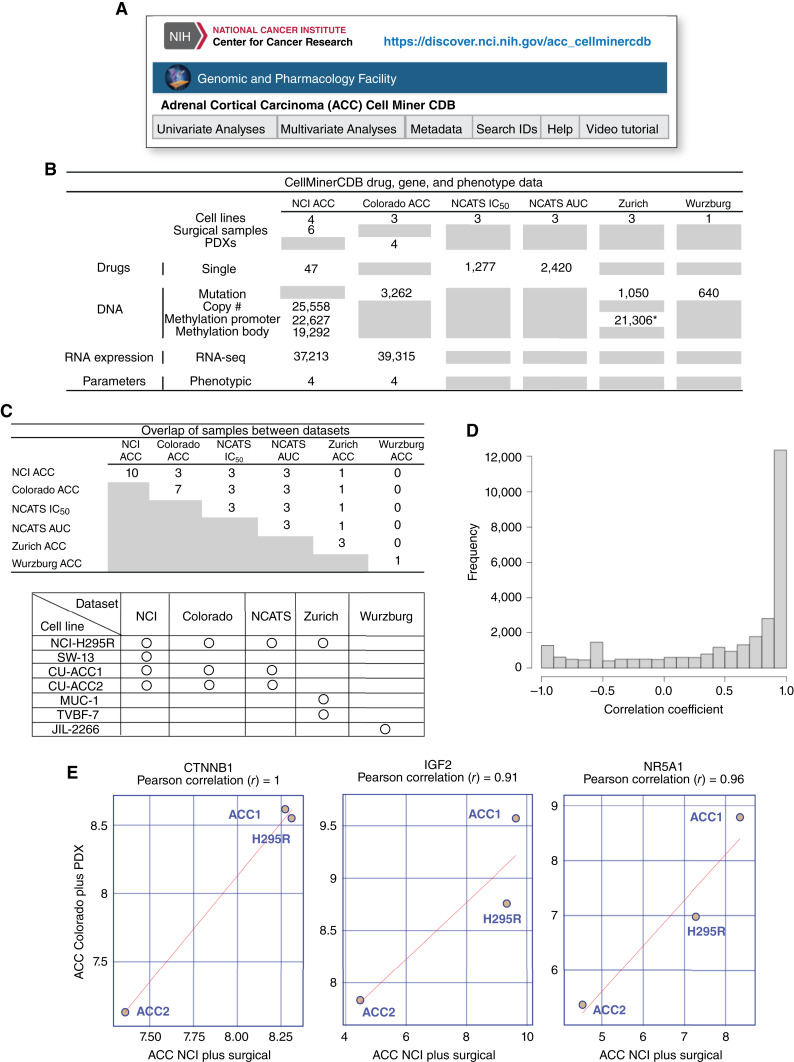
Overview of the datasets and reproducibility of ACC CellMiner. A, URL and snapshot of the website for ACC_CellMinerCDB. B, Summary of the molecular and drug activity data for cell lines, patient-derived mouse xenografts, and surgical samples included in ACC CellMiner. For each type of molecular and drug data, numbers indicate how many genes or drugs are included. Gray boxes indicate items with no data. C, Table of samples overlapping between datasets (top) and cell lines included in each dataset (bottom). D, Distribution of gene expression correlation between “ACC NCI plus surgical” and “ACC Colorado plus PDX” data sets. E, CTNNB1, IGF2, and NR5A1 gene expressions in the two data sets are plotted, and Pearson’s correlation coefficients are shown at the top of the plots. *Only the TVBF-7 cell line has methylation data.

