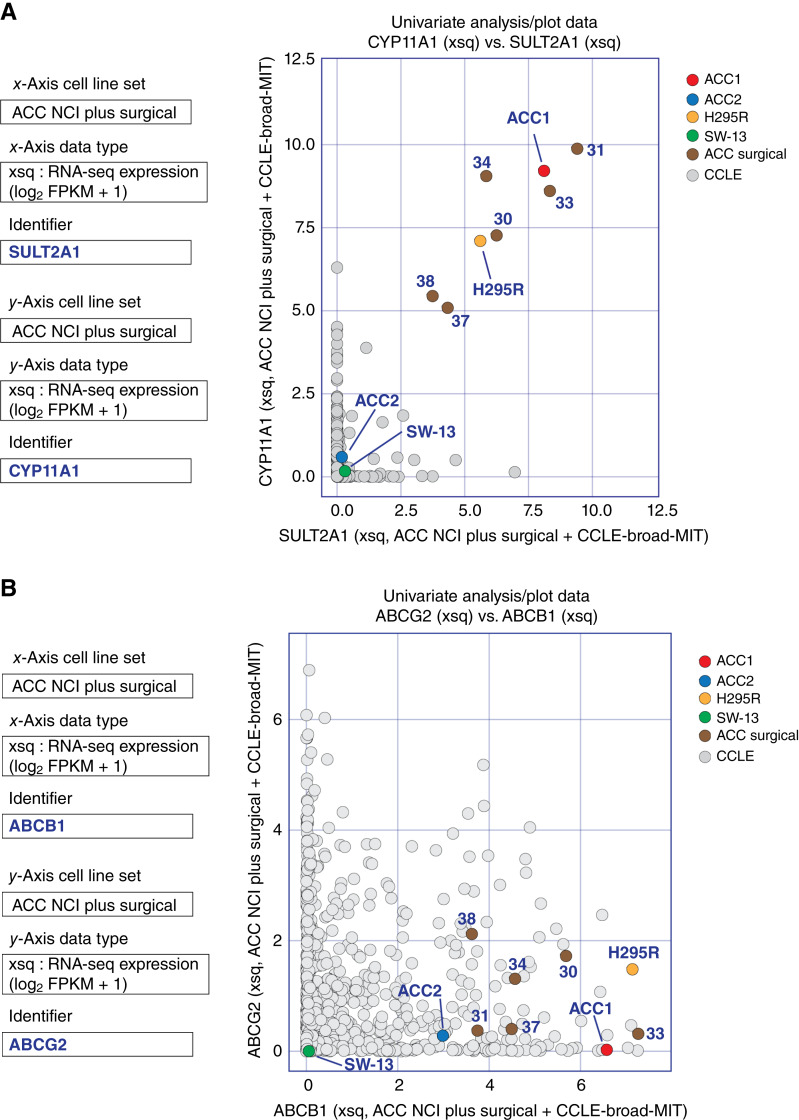
Figure 2.
RNA-seq (xsq) expression of hormonal and drug efflux genes in the ACC cell lines and surgical samples. A, Univariate analysis scatterplot of the hormonal genes SULT2A1 (sulfotransferase family 1A member 1) vs. CYP11A1 (cytochrome P450 family 11 subfamily A member 1) transcript levels in ACC NCI cell lines and surgical samples. Transcript levels of the two genes in the 1,011 cell lines in the CCLE dataset were merged. B, Univariate analysis scatterplot of the drug transporters ABCB1 (MDR1) vs. ABCG2 (BCRP) transcript expression levels in ACC NCI cell lines and surgical samples. Transcriptional expression levels of ABCB1 and ABCG2 in the 1,011 cell lines of the CCLE dataset were merged with the ACC data.

