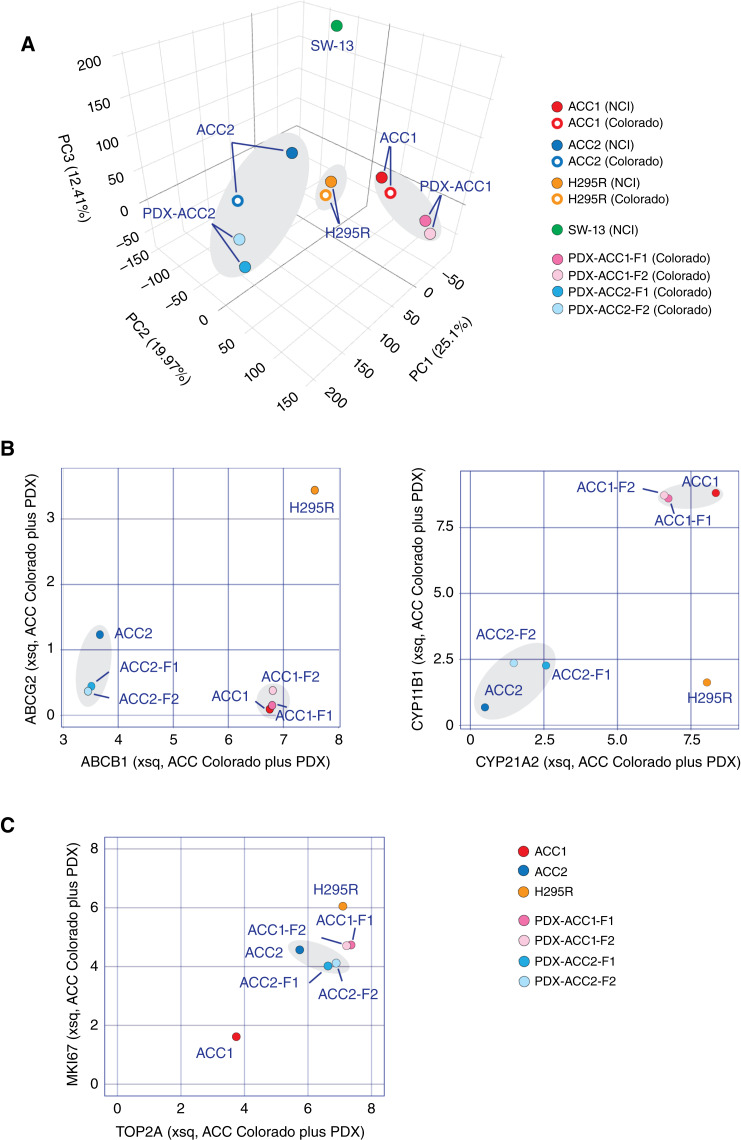
Figure 3.
Comparison of gene expression of CU-ACC cell lines and original PDXs. A, Overall correlation between gene expression in the cancer cell lines evaluated at the NCI and CU and their corresponding PDXs. Areas shaded in gray highlight the grouping of corresponding ACC cell lines and PDXs. B, Examples of coherent genes. Univariate analysis scatterplot of ABCB1 (MDR1) transcriptional expression level vs. ABCG2 (BCRP) and CYP21A2 transcriptional expression level vs. CYP11B1 transcriptional expression level. C, Example of differentially expressed genes related to cellular proliferation for the CU-ACC1 and CU-ACC2 cell lines and corresponding PDXs.

