Fig 1.
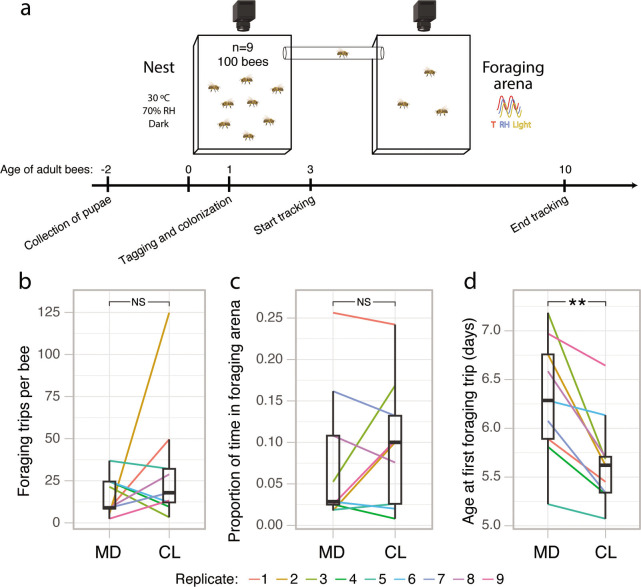
The gut microbiota accelerates the onset of foraging-like behavior under an automated behavioral tracking system. (a) Timeline and experimental setup for the automated behavioral tracking experiment. In each experimental replicate, two groups of 100 gnotobiotic bees (either microbiota depleted or colonized) could move freely between two Plexiglass boxes connected by a plastic tube and hosted in separate climate-controlled chambers. (b) Average number of trips between the nest and the foraging arena per bee for each sub-colony in the automated behavioral tracking experiment. (c) Average proportion of time spent in the foraging arena per bee for each sub-colony. (d) Average age at which bees made their first trip to the foraging arena for each sub-colony. Lines connect paired sub-colonies and are colored by experimental replicate. Boxplots show the median and first and third quartiles. Whiskers show the extremal values within 1.5×, the interquartile ranges above the 75th and below the 25th percentile. **P < 0.01; NS, not significant, as calculated by paired t-test (two sided). The camera and bee icons in panel a were created with BioRender.com.

