Fig 2.
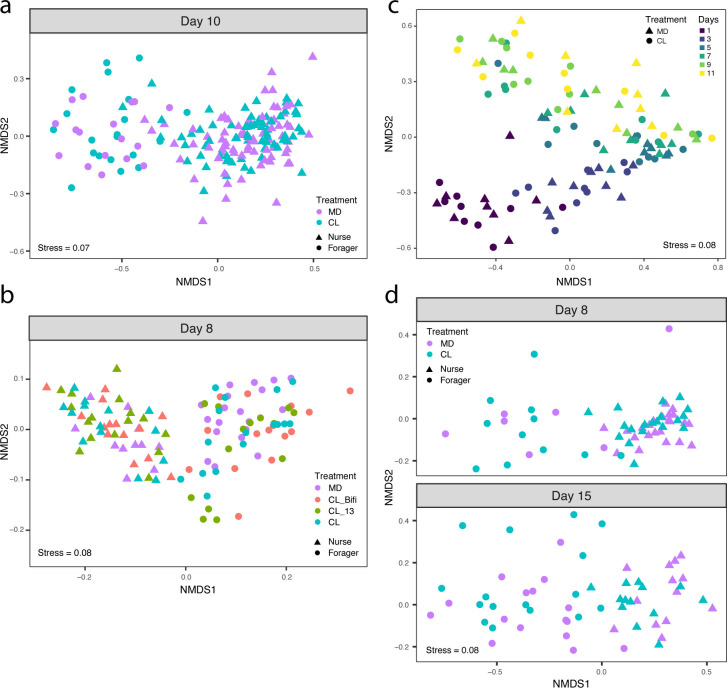
The gut microbiota does not affect CHC profile. (a) Non-metric multidimensional scaling (NMDS) of Bray-Curtis dissimilarities between CHC profiles in the automated behavioral tracking experiment (MD, n = 88; CL, n = 89). (b) NMDS of Euclidean distances between CHC profiles in the RNA-sequencing experiment, after removal of batch effects from two separate GC-MS runs (MD, n = 31; CL_Bifi, n = 29; CL_13, n = 30; CL, n = 30). (c) NMDS of Bray-Curtis dissimilarities between CHC profiles in the longitudinal experiment (MD, n = 54; CL, n = 54). (d) NMDS of Bray-Curtis dissimilarities between CHC profiles in the single-colony experiment (MD, n = 59; CL, n = 59). Samples are colored by gut microbiota treatment, and shapes indicate nurses and foragers in panels a, b, and d. Samples in panel c are colored by age of the sampled bees, and shapes indicate treatment group.

