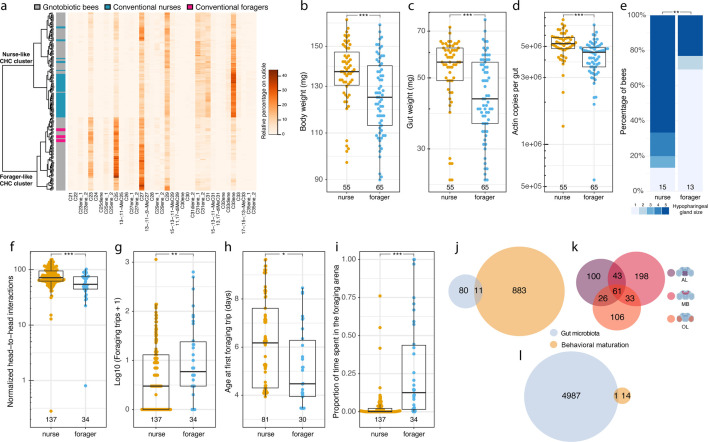
Fig 4.
Gnotobiotic bees reared in cages diverge into nurses and foragers showing differences in physiology and behavior. (a) Heatmap of relative abundance of detected CHCs on the cuticle of gnotobiotic bees in the RNA-sequencing experiment (8-day-old bees; n = 120; shown in gray in the annotation column toward the left) and conventional nurses (n = 51) and foragers (n = 9) randomly collected from the same hives in blue and pink, respectively. The dendrogram toward the left shows clustering of CHC profiles based on Euclidean distances using Ward’s criterion. (b) Fresh body weight, (c) gut wet weight, (d) number of Actin copies in the gut, and (e) hypopharyngeal gland size of CHC-classified nurse and forager gnotobiotic bees in the RNA-sequencing experiment (8-day-old bees). (f–i) Boxplots reporting the number of head-to-head interactions (normalized by group size) (f), trips to the foraging arena (g), the age at first foraging trip (h), and the proportion of time spent in the foraging arena (i) over the week of tracking for the gnotobiotic nurses and foragers classified based on their CHC profiles at the end of the automated behavioral tracking experiment (10-day-old bees). ***P < 0.001; **P < 0.01; *P < 0.05; NS, not significant. Numbers at the bottom of boxplots and stacked bars in panels b to i indicate sample sizes. (j) Venn diagram reporting overlap in the brain between the differentially expressed genes (DEGs) associated with the gut microbiota (as identified in reference 7) and those associated with behavioral maturation (CHC-classified gnotobiotic nurses vs foragers). (k) Venn diagram reporting overlap in DEGs in brain region-specific comparisons of CHC-classified gnotobiotic nurses vs foragers. (l) Venn diagram reporting overlap in the gut between the DEGs associated with the gut microbiota (as identified in reference 7) and those associated with behavioral maturation. The brain icons were created with BioRender.com.

