Fig 5.
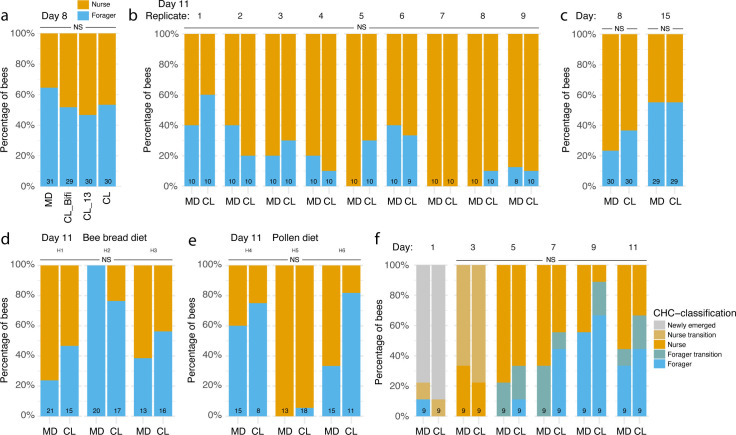
Proportions of nurses and foragers across the experiments. Stacked bars report the percentage of CHC-classified gnotobiotic nurses and foragers (based on clustering of Euclidean distances in CHC profiles using the Ward’s criterion) in the RNA sequencing (a), automated behavioral tracking (b), single-colony CHC (c), longitudinal weight gain with either bee bread (d) or pollen diet (e), and time-series CHC (f) experiments. Numbers at the bottom of stacked bars indicate sample sizes. NS, not significant.

