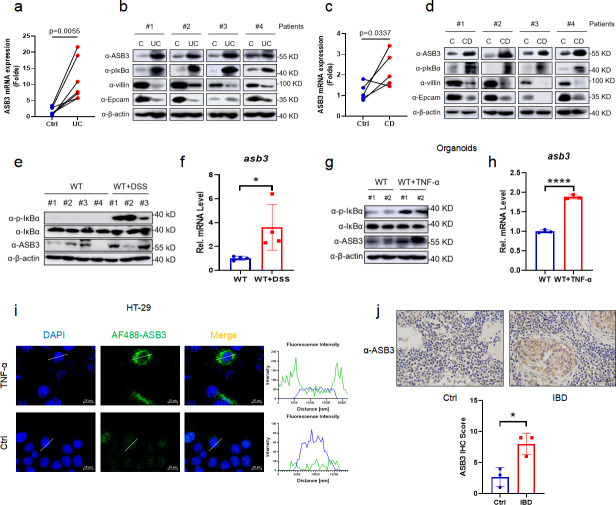
Fig 1.
Abnormal ASB3 expression levels in IBD patients and mice with DSS-induced colitis. (a) The mRNA expression of ASB3, IL-1β, IL-6, and TNF-α was measured in both UC groups (n = 7) relative to controls. (b) Representative immunoblotting of p-IκBα, IκBα, ASB3, villin, EpCAM, and β-actin protein expression in UC. (c) The mRNA expression of ASB3, IL-1β, IL-6, and TNF-α was measured in both CD groups (n = 5) relative to controls. (d) Representative immunoblotting of p-IκBα, IκBα, ASB3, villin, EpCAM, and β-actin protein expression in CD. (e) The expression of p-IκBα, IκBα, ASB3, and β-actin proteins in the colons of DSS-treated or untreated mice was detected by Western blotting. (f) The mRNA expression levels of ASB3 in the colons of DSS-treated or untreated mice were determined by quantitative real-time RT-PCR (qPCR) assay. (g) The expression of p-IκBα, IκBα, ASB3, and β-actin proteins in TNF-α-treated or untreated organoids was detected by Western blotting. (h) The mRNA expression levels of ASB3 in the organoids of TNF-α-treated or untreated mice were determined by qPCR assay. (i) HT-29 cells were treated with TNF-α (150 ng/mL) for 12 h and then stained with indicated antibody and secondary antibody. The nuclei were stained by DAPI. Scale bars, 50 µm. (j) Representative IHC staining and quantification of ASB3 in colon tissues collected from IBD patients. Scale bars, 50 µm. P values less than 0.05 were considered statistically significant (*P < 0.05, **P < 0.01, ***P < 0.001, and ****P < 0.0001) in panels a and c by paired Student’s t test and in panels c, f, h, and j by unpaired Student’s t test.

