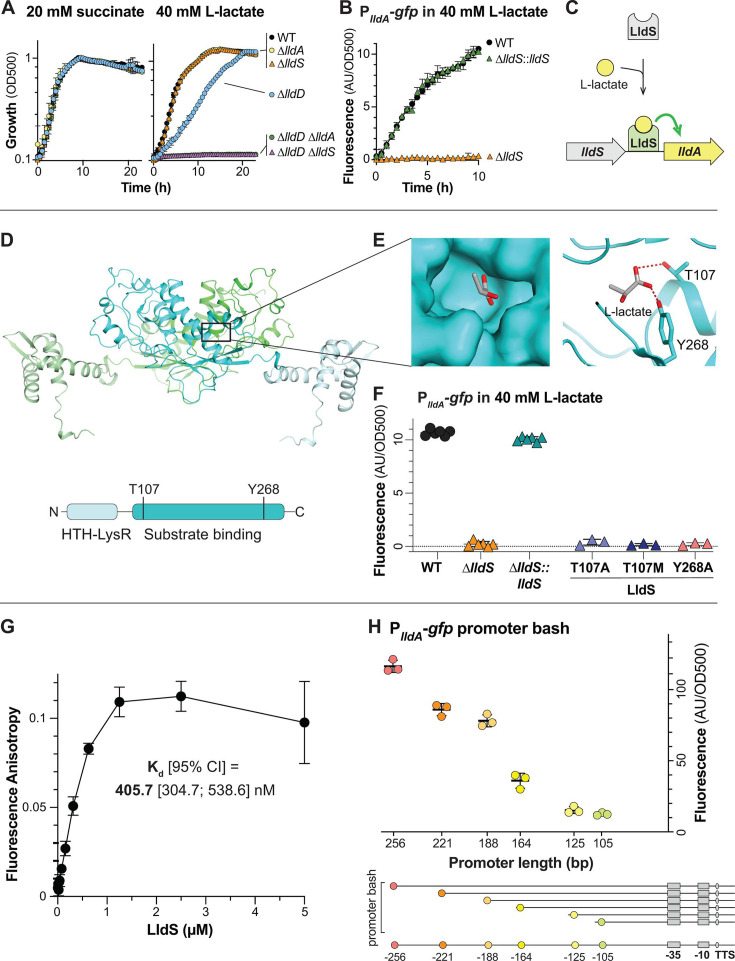
Fig 2.
LldS (PA14_33840) is necessary for expression of lldA and likely senses L-lactate via its ligand-binding domain. (A) Growth of wild-type (WT) and mutants, lacking various genes associated with lactate metabolism, as liquid cultures in MOPS medium containing 20 mM succinate (left) or 40 mM L-lactate (right) as the sole carbon source. (B) lldA promoter activity in liquid cultures of WT, ∆lldS, and the ∆lldS complementation strain grown in MOPS medium containing 40 mM L-lactate. We observe that growth of ∆lldS under this condition is supported by LldD, as indicated by the results in panel A. (C) Schematic of the proposed mechanism regulating lldA expression. (D) (Top) AlphaFold-predicted structure of the LldS dimer with the individual monomers colored green and cyan and with lighter shades representing the DNA-binding domains. (Bottom) Domain architecture of the LldS protein. (E) Left: molecular surface of the predicted LldS binding pocket, containing L-lactate. Right: ribbon model of the predicted LldS binding pocket with two residues, T107 and Y268, shown interacting with L-lactate. (F) lldA promoter activity in liquid cultures of ∆lldS strains complemented with wild-type lldS or with the LldS point mutants T107A, T107M, and Y268A. Strains were grown in MOPS medium containing 40 mM L-lactate. Fluorescence values were taken 5–6 hours after the onset of the stationary phase. Data points represent biological replicates, and error bars represent standard deviation. (G) Binding curve of LldS to a 5’FAM-labeled DNA probe containing 256 bp upstream of the start codon of lldA. Protein concentrations ranged from 9.3 nM to 5 µM, and the probe concentration was 5 nM. The calculated Kd value is shown, and error bars represent standard deviation of two to three replicates per concentration. (H) Top: fluorescence of PlldA-gfp reporter strains with promoter regions of the indicated length. Each value was normalized by subtracting the average background fluorescence value of ∆lldS containing the full-length promoter construct. Cultures were incubated for 15 hours in MOPS medium containing 40 mM L-lactate. Data points represent biological replicates, and error bars represent standard deviation. Bottom: diagram depicting the truncations made for “promoter bash” constructs. The predicted −10 and −35 boxes and transcription start site (TSS) are indicated. These motifs were identified using the SAPPHIRE tool (27). For plots shown in panels A and B, error bars represent the standard deviation of biological triplicates and are obscured by the point marker in some cases.

