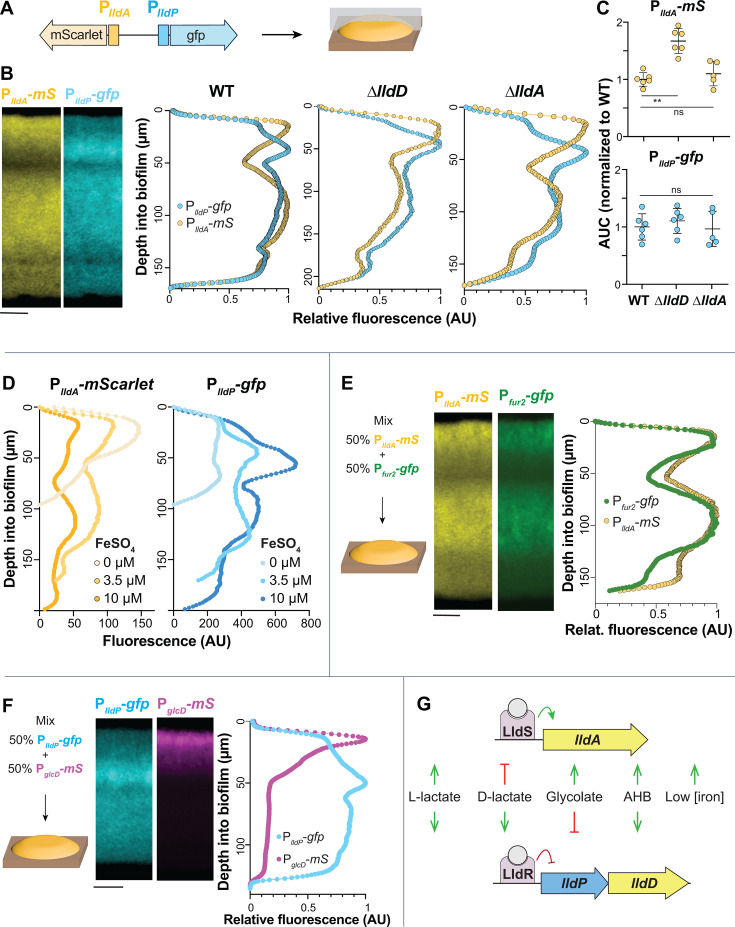
Fig 5.
Biofilms display patterns of lldA and lldPDE expression across depth, which might arise from local differences in iron availability and glycolate production. (A) Schematic showing the genomic arrangement of the dual reporter construct (PlldA-mScarlet, PlldP-gfp) used in these experiments and the orientation of thin-sectioning for a macrocolony biofilm. (B) Left: fluorescence images of a thin-section from a biofilm formed by the dual PlldA-mScarlet (“mS”), PlldP-gfp reporter strain. mScarlet fluorescence is shown in yellow, and gfp fluorescence is shown in cyan. Right: fluorescence across biofilm depth for the PlldA and PlldP reporters in the indicated strain backgrounds. Images and quantification are representative of at least three biological replicates. (C) Quantification of total dual-reporter thin-section fluorescence expressed as the area under the curve (AUC) for lldA (top) and lldPDE (bottom) reporters in WT, ∆lldD, and ∆lldA, normalized to average wild-type fluorescence. Each dot is representative of a single biological replicate, and error bars represent standard deviation. **P < 0.01, ns = not significant. (D) Fluorescence across biofilm depth for each reporter in biofilms of the dual-reporter strain grown on medium amended with ferrous sulfate as indicated. Profiles are representative of three biological replicates for each iron availability condition. (E) Left: schematic of the experimental design for growth of biofilms containing two reporter strains: PlldA-mScarlet and Pfur2-gfp. Center: fluorescence images of thin-section from a mixed biofilm. mScarlet fluorescence is shown in yellow, and gfp fluorescence is shown in green. Right: fluorescence across biofilm depth for the PlldA-mScarlet and Pfur2-gfp reporters. Images and quantification are representative of four biological replicates. (F) Left: schematic of the experimental design for growth of biofilms containing two reporter strains: PglcD-mScarlet and PlldP-gfp. Center: fluorescence images of a thin-section from a mixed biofilm. mScarlet fluorescence is shown in magenta, and gfp fluorescence is shown in cyan. Right: fluorescence across biofilm depth for the PglcD-mScarlet and PlldP-gfp reporters. Images and quantification are representative of four biological replicates. (G) Visual summary of the cues that activate or inhibit the expression of P. aeruginosa lldA and lldPDE. Biofilms in panels B, D, E, and F were grown on MOPS medium containing 20 mM succinate and 10 mM L-lactate. Scale bars = 25 µm.

