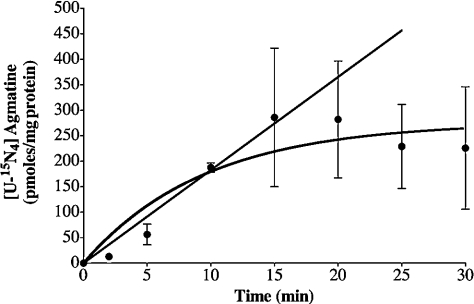
Figure 2. Time-course of 15N-labelled agmatine production during the incubation of whole mitochondria with [U-15N4]arginine.
Experiments were performed with [U-15N4]arginine (2 mM) and other metabolites as indicated under the Materials and methods section. The line shows the best fit (r2=0.87) of a single-phase exponential association [Y=Ymax*(1−e(−kt))]. The straight line corresponds to the linear stage of the reaction (r2=0.97). 15N-labelled agmatine was determined by the product of 15N enrichment (at.% excess/100) times total amount (pmol/mg of protein). Results are expressed as means±S.D. for 4–6 independent experiments.

