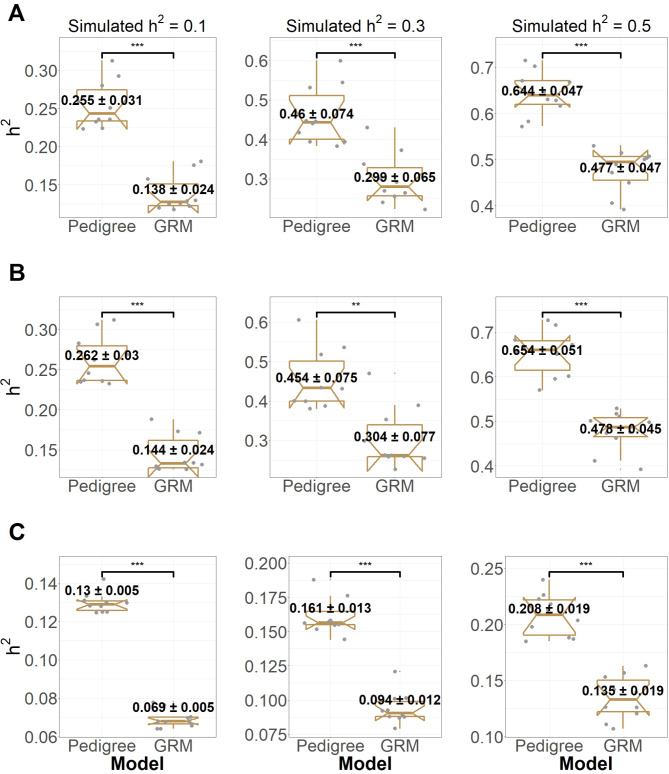
Fig. 2.
Differences between estimated heritability. The heritabilities were estimated based on genealogical information (pedigree) and genomic relationship matrix (GRM) in simulation study for three different familial structures, including all families (A), all families with ≥ 1 generation (B), and families with ≥ 1 generation in which both case control individuals are presented (C). In each plot, mean of estimated heritability based on the two different models was significantly differed at p-value < 0.01 (**) or 0.001 (***) based on a t-test

