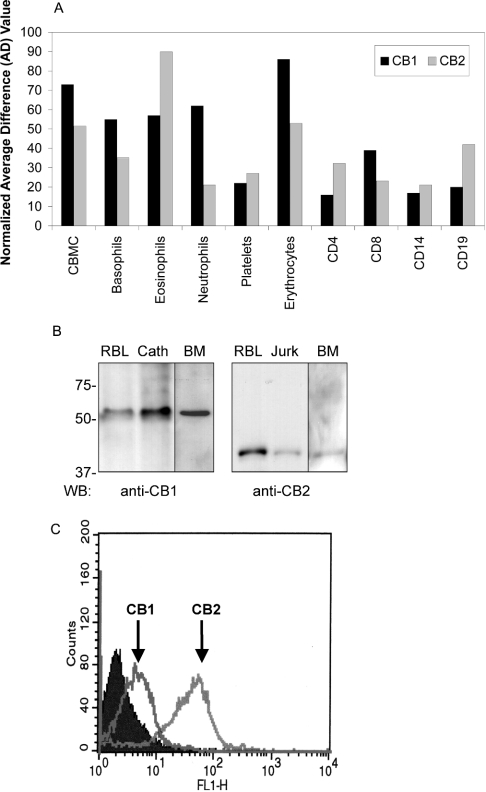
Figure 1. Cannabinoid receptor subtype 1 (CB1) expression in primary and transformed mast cells.
(A) Transcript levels for CB1 and CB2 in human haematopoietic cells. Hybridization data were extracted from human genome-wide expression analysis (Affymetrix U133A) array and probed with cDNA derived from the indicated cell sources. CBMCs (cord blood derived mast cells) were derived from human CD34+ cord blood progenitor cells. Basophil populations were isolated from peripheral human blood buffy coat by Percoll gradient separation and negative selection. CD14+ monocyte/macrophages were purified from peripheral blood using positive selection. Black bars indicate hybridization to hCB1 (NM016083) and grey bars indicate hybridization to hCB2 (NM001841) gene spots. Data are expressed as fold increases in hybridization relative to normalized background hybridization levels from one representative experiment. (B) Western-blot analysis of CB1 and CB2 protein expression in RBL2H3 mast cells and primary BMMCs. Left panel: post-nuclear lysates from 2×10⁶ RBL2H3 (RBL), Cath.a cells (neuronal positive control for CB1 expression), and 1×10⁷ murine primary BMMCs (BM) were acetone precipitated to recover protein, and resolved by SDS/PAGE (10% polyacrylamide). After electrotransfer to PVDF, Western blotting was performed using 0.1 μg/ml rabbit polyclonal anti-CB1. Predicted molecular mass of CB1 is 53 kDa. Right panel: post-nuclear lysates from 2×10⁶ RBL2H3 (RBL) or Jurkat (lymphocyte positive control for CB2 expression) cells were acetone precipitated to recover protein, and resolved by SDS/PAGE (10% polyacrylamide). After electrotransfer to PVDF, Western blotting was performed using 0.5 μg/ml rabbit polyclonal anti-CB2. The predicted molecular mass of CB2 is 38 kDa. Molecular mass markers are shown in kDa. n=5 for RBL2H3 and Cath.a and n=2 for BMMC. (C) Flow cytometry analysis of CB1 and CB2 surface expression in RBL2H3 mast cells. Intact RBL2H3 were stained using anti-CB1 or anti-CB2 antibodies as described in the Experimental section. Antibody epitopes are peptides derived from the extreme amino-terminal (extracellular) domains of CB1 and CB2 respectively. Positive staining in intact, non-permeabilized cells therefore represents possible surface localization of CB1 and CB2. Staining was visualized using an Alexa-488 conjugated donkey anti-mouse IgG secondary antibody. Filled area represents secondary antibody staining control. Open areas represent cell samples stained, separately, for CB1 or CB2 as indicated (n=2).

