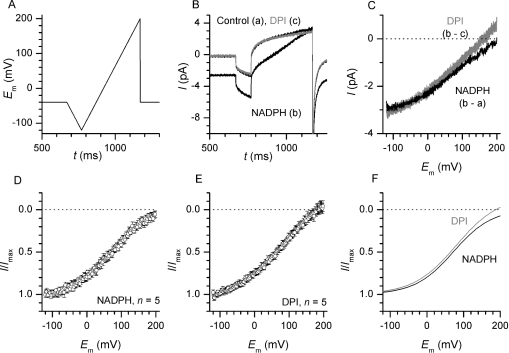
Figure 2. I–V of electron currents and of DPI inhibition.
(A) Voltage-ramp protocol. Every 10 s, a series of fast (8 mV/ms, see Supplementary Figure 1, http://www.BiochemJ.org/bj/388/bj3880485add.htm) and slow (0.8 mV/ms) voltage ramps were applied from the −40 mV holding potential. For clarity, only the slow ramp waveform is shown. (B) Ramp currents recorded before and after bath application of 1.6 mM NADPH and after DPI inhibition (grey line). Traces are an average of three contiguous recordings. Current deflections during initiation and reversal of the voltage ramps reflect the charge and discharge of the patch-clamp circuit capacitance. (C) The NADPH-induced (black) and DPI-sensitive (grey) currents, derived by subtracting the traces shown in (B), are plotted against the corresponding ramp voltage. Currents recorded during hyperpolarizing ramps were used to correct for minor current offsets arising from electrode capacitance changes (see the Experimental section and Supplementary Figure 1, http://www.BiochemJ.org/bj/388/bj3880485add.htm). (D, E) Averaged I–Vs of five patches measured during sequential application of 1.6 mM NADPH (D) and 12 μM DPI (E). For clarity, only 100 of the 3200 data points are shown on the I–V curves. (F) Sigmoidal fit of the mean results reveals only minor difference between the two approaches used to obtain electron current I–V.

