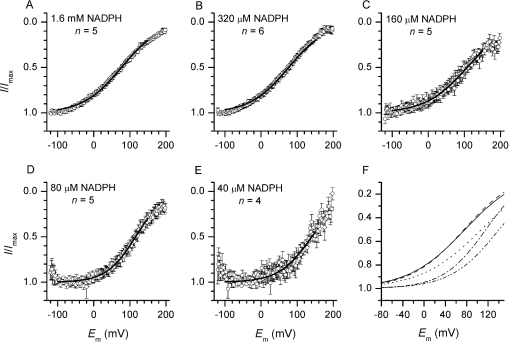
Figure 3. I–V of electron currents recorded at different concentrations of NADPH.
Electron currents were evoked by bath application of different concentration of NADPH. (A–E) Averaged Ie–Vs recorded at different [NADPH] and normalized to the maximal current amplitude. Traces are smoothed with a 19-point running average and only 160 of the 3200 data points are shown. Sigmoidal fits of the averaged Ie–Vs between −100 and 150 mV are shown as black lines. (F) Superimposed fits from (A–E). A progressive shift of the half-maximal electron current amplitude to positive voltages occurs with decreasing substrate concentration. Below 320 μM NADPH, a voltage-independent section becomes visible. NADPH concentrations are: 1.6 mM (——), 320 μM (– –), 160 μM (- - -), 80 μM (-·-·) and 40 μM (-· ·-).

