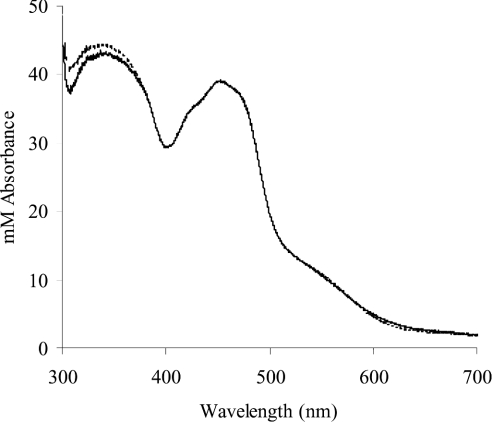
Figure 2. Comparison of the near-UV/visible spectrum of human milk XOR with that simulated by manipulation of the iron-sulphur/FAD ratios of the bovine spectrum.
The spectrum of native human enzyme is shown together with the spectrum simulated as described in the Results section. The two spectra are coincident above 400 nm, and nearly so from 300 nm. In the 300–400 nm range, the spectrum showing the higher absorbances is the simulated spectrum.

