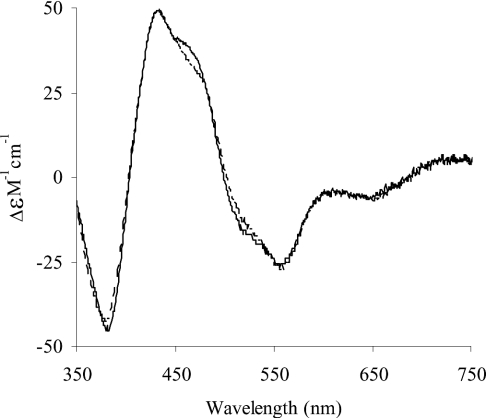
Figure 4. Comparison of the near-UV/visible CD molar spectrum of human milk XOR with that of bovine XOR after normalization for iron sulphur content.
The spectrum of the bovine enzyme is shown, together with that of the human enzyme, after correction for iron sulphur deficiency, as described in the Results section. - - - -, bovine XOR simulated; ——, human XOR.

