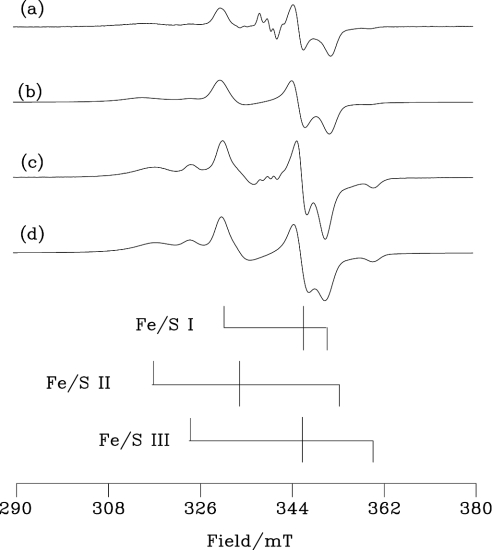
Figure 6. Fe/S EPR spectra of human and bovine milk XOR.
(a) The bovine XOR sample of Figure 5(c) and (c) the human enzyme of Figure 5(d). The stick diagrams indicate the g1, g2 and g3 positions for Fe/S I, II and III (data from Table 1) of the human enzyme. EPR was run at 15 K, with 5 mW microwave power at 9.355 GHz using 1.0 mT field modulation at 100 kHz; the conversion time was 40.96 ms with a time constant of 82 ms. Each spectrum is the sum of two scans. (b, d) Simulations of the bovine and human enzymes respectively using the g-values, line widths and occupancies from Table 1.

