Fig. 5.
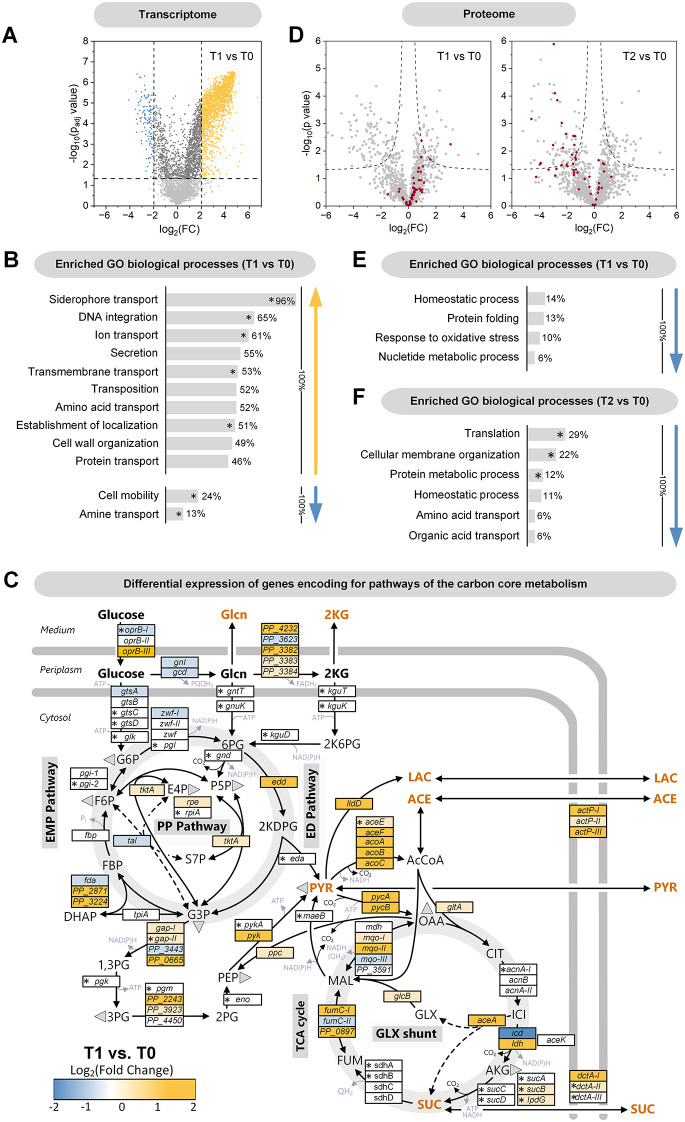
Transcriptomic and proteomic changes during bio-electrochemical fermentation of P. putida KT2440 on glucose. Volcano plot of global transcriptomic differences between 0 h (T0) and 24 h (T1) (A). Assignment of transcriptional changes between 0 h and 24 h to GO biological processes (Gene Ontology), n = 4. (B). The given percentage depicts the coverage of a category by significantly changed transcripts. Significantly enriched GO biological processes are marked * (Fisher’s exact test). Expression dynamics of genes related to the central carbon core metabolism between 0 h and 24 h (C). For completeness, non-significantly changed genes are included (marked *, Benjamini‒Hochberg FDR > 0.05), n = 4. Volcano plots of global proteomic changes between 0 h (T0), 24 h (T1), and 100 h (T2) (D), n = 3. Ribosomal proteins are labelled red. Assignment of proteomic changes between 0 h and 24 h (E), as well as 0 h and 100 h (F) to GO biological processes. The given percentage depicts the coverage of a category by significantly changed proteins. Significantly enriched GO biological processes are marked * (Fisher’s exact test)

