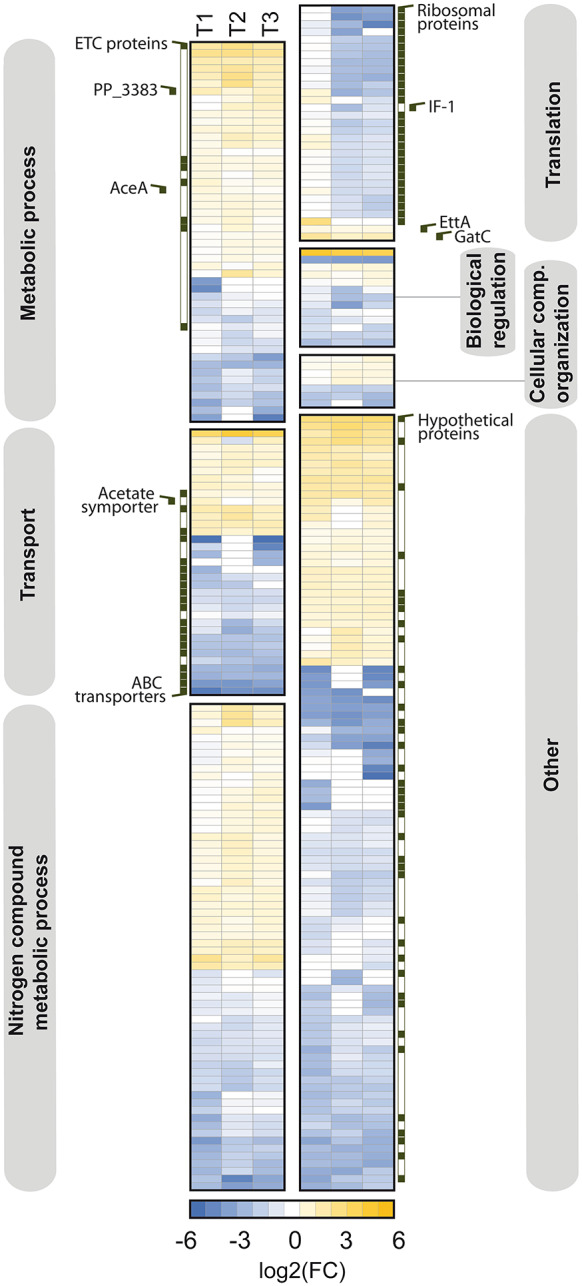
Fig. 6.

Hierarchical clustering of proteomic changes during bio-electrochemical fermentation of P. putida KT2440 on glucose. The heatmap depicts significant changes in the proteome between 0 h and 24 h (T1), 100 h (T2), as well as 380 h (T3), n = 3. Significantly changed proteins (-1 > log2-fold > 1, p value < 0.05) are grouped with one way ANOVA against the start sample, whereby the grouping is based on the corresponding Gene Ontology “biological process” annotations
