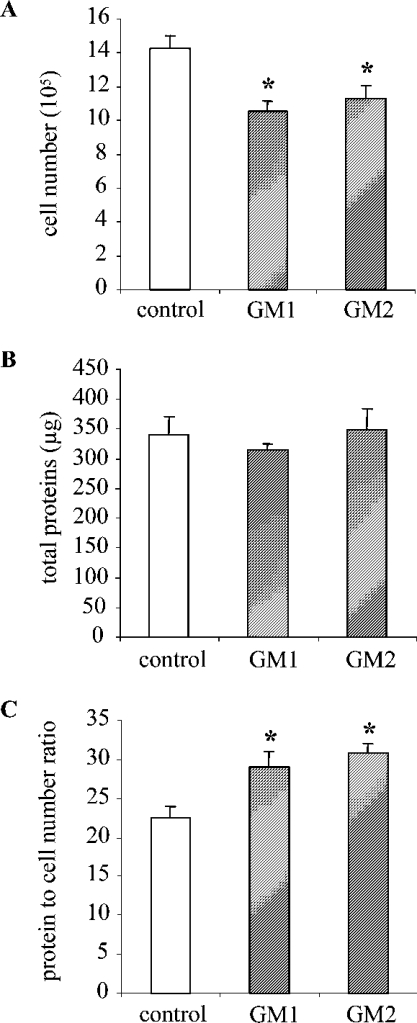
Figure 5. GM2 and GM1 gangliosides induce mesangial cell hypertrophy.
RMC were cultured in the presence of GM2 or GM1 (60 μM) for 48 h. Control conditions were complete medium with a mixture of BSA and 10 mM Hepes (pH 7.4). Cells were then harvested and counted using a haemocytometer and total protein content was measured. Cell number (expressed for 105 cells) (A) and total protein content (expressed in μg) (B) are presented. The total protein/cell number ratio used to assess hypertrophy is expressed in μg of protein/105 cells (C). Results are the means±S.E.M. for 4–6 independent experiments. *P<0.05 versus control.

