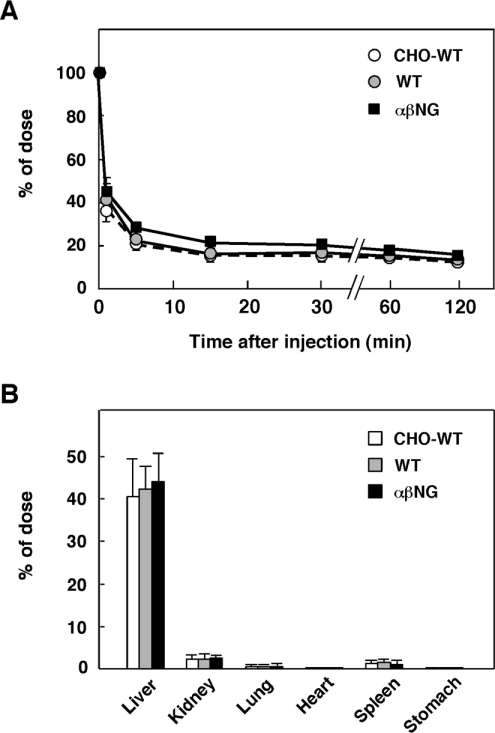
Figure 7. Changes in plasma levels and organ distribution of glycosylated and non-glycosylated HGFs in mice.
(A) Changes in plasma levels of 125I-labelled HGFs. Glycosylated (CHO-HGF-WT and HGF-WT) and non-glycosylated HGF (HGF-αβNG) were radiolabelled with 125I, and intravenously injected into mice. Radioactivities in plasma samples are expressed as a percentage of the dose. Each value represents the means±S.D. of measurements using three mice. (B) Organ distribution of 125I-labelled HGFs. Radioactivity per whole organ was measured 15 min after intravenous injection of 125I-labelled HGFs and expressed as a percentage of each dose. Each value represents the means±S.D. of measurements using three mice.

