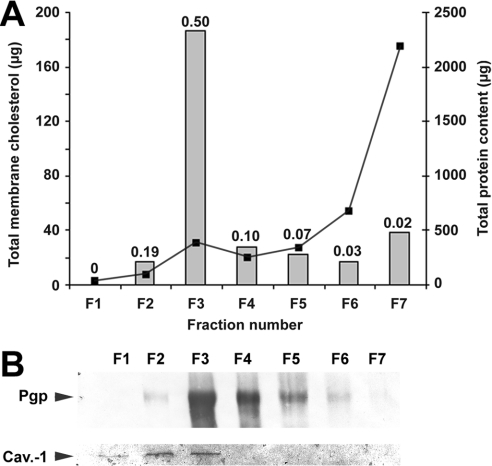
Figure 1. Distribution of total cholesterol from CEM/VLB5 cell membranes among the seven fractions resulting from the isolation procedure and P-gp localization of DRMs.
Membrane fractionation was performed as described in the Materials and methods section. (A) Proteins (curve) and total cholesterol (bars) contents of each fraction of equal volume were measured as described in the Materials and methods section. Numbers above the bars represent the membrane cholesterol/total protein ratio (mg/mg). (B) Immunoblot of P-gp (upper row) and caveolin-1 (lower row) after electrotransfer of 10 and 40 μg of proteins respectively from each CEM/VLB5 membrane fraction, as described in the Materials and methods section. One typical result from duplicate experiments is presented.

