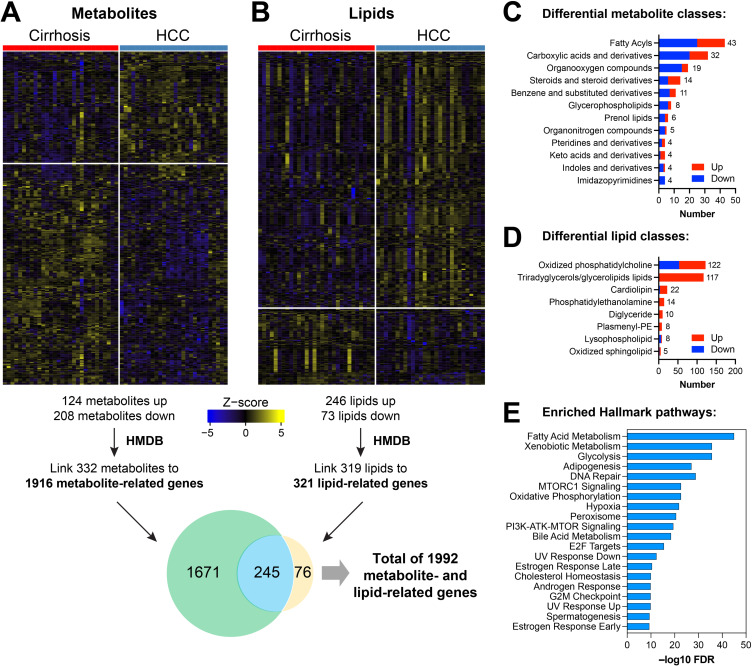
Figure 2.
Differential metabolomic and lipidomic analysis. Heatmaps showing differential expression of metabolites (A) or lipids (B) using a cutoff of FDR<0.25, comparing serum samples collected before diagnosis for cases (patients with cirrhosis who developed HCC) and controls (patients with cirrhosis and no HCC). Top classes of differentially expressed (C) metabolites and (D) lipids were determined and stratified by direction of regulation in HCC. Differentially expressed metabolites or lipids were linked to related genes using the Human Metabolome Database (HMDB). Genes associated with metabolites or lipids were determined, as shown in the Venn diagram. (E) Pathway analysis of the genes associated with both DEMs and DELs using the Hallmark geneset compendium.

