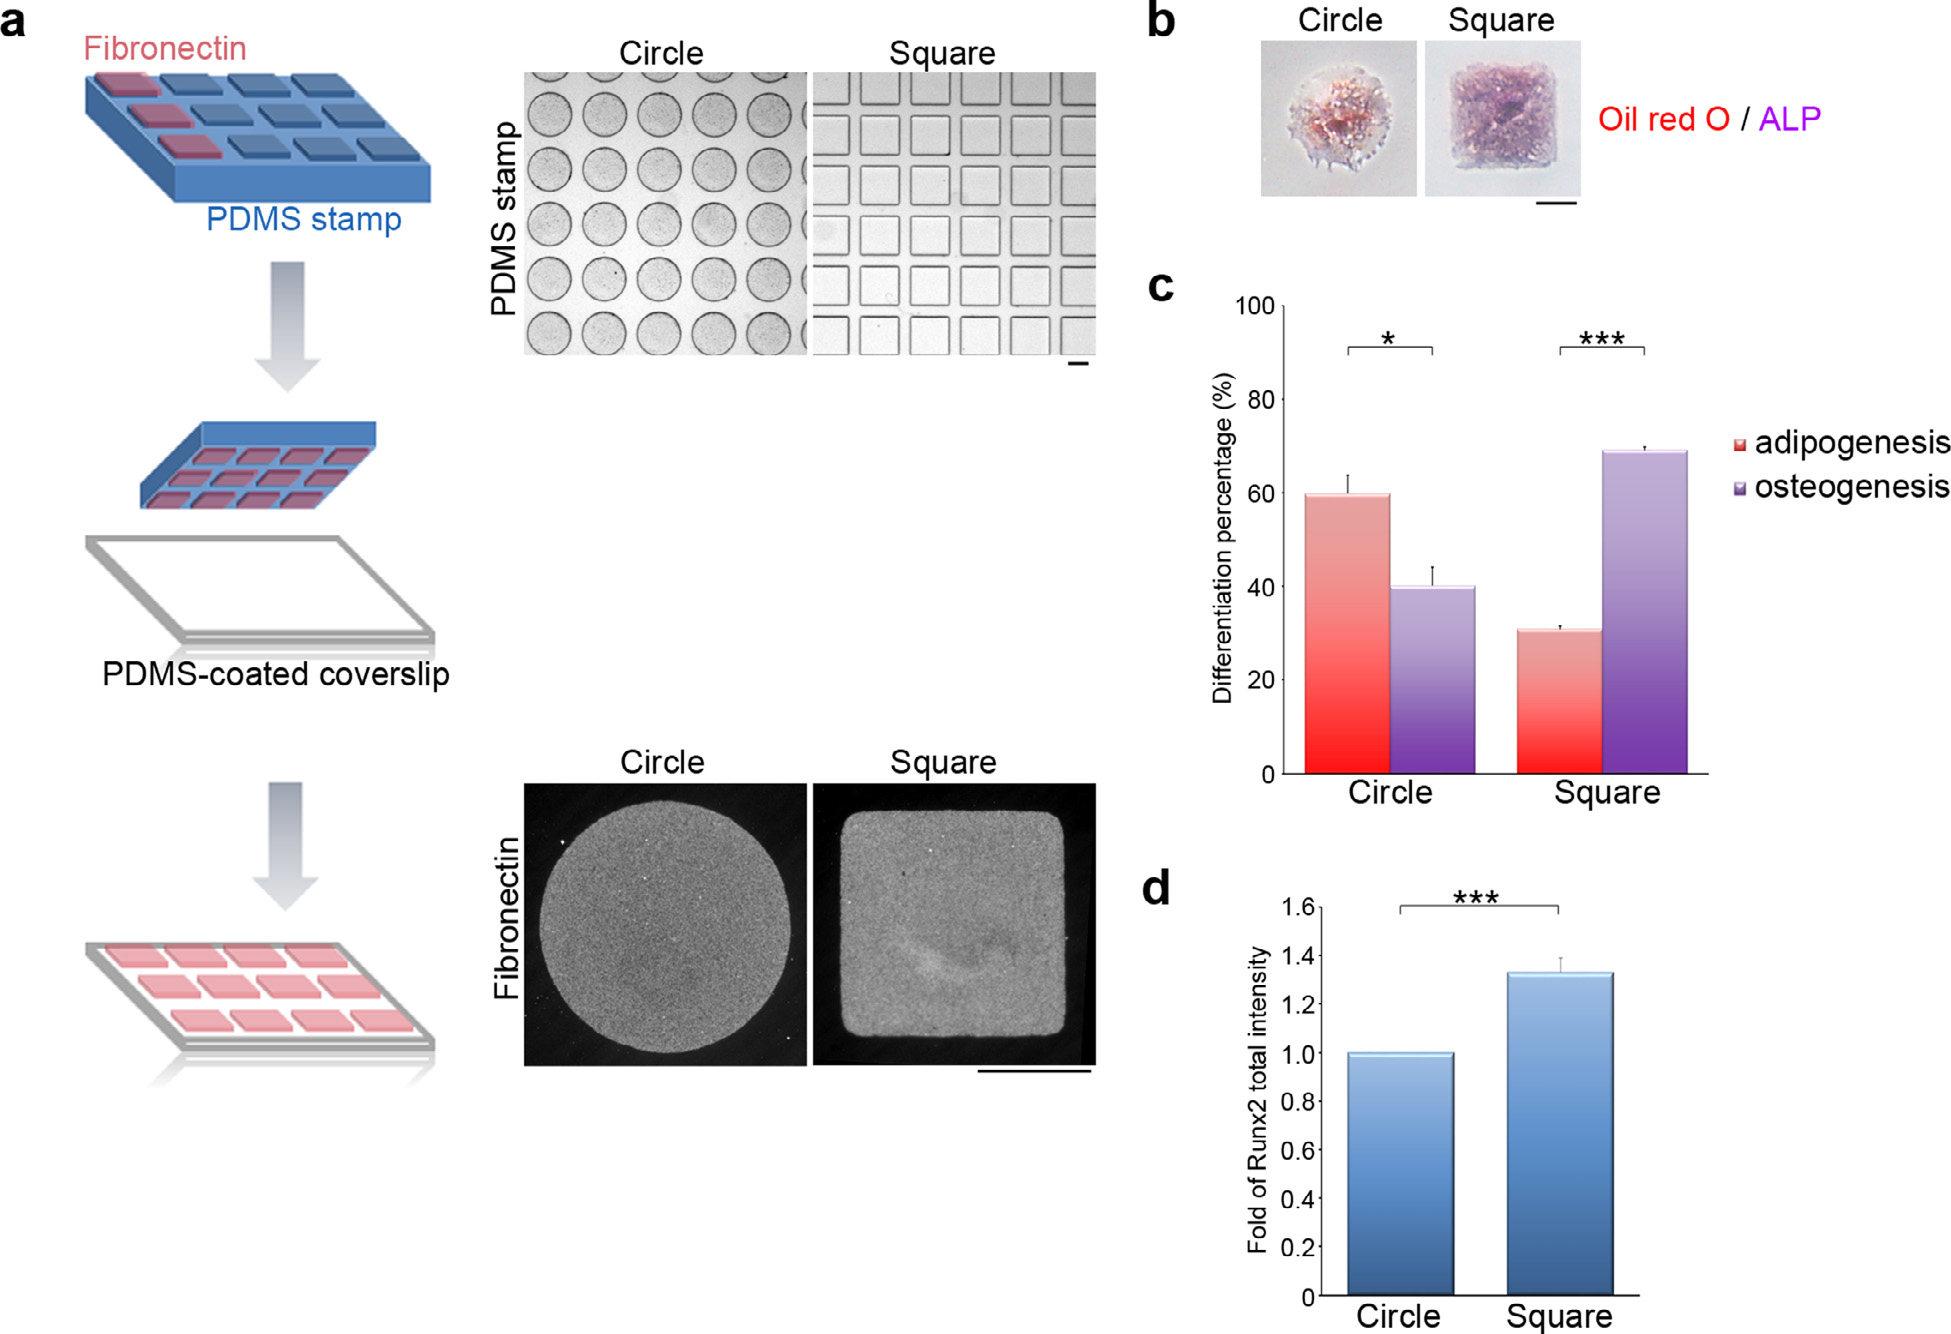
Fig. 1. MSC osteogenesis vs. adipogenesis depends on cell geometry.

(a) Left: A schematic illustration of the microcontact printing method used to control cell shape. Up-right: A polydimethylsiloxane (PDMS) stamp with micron-sized features, shown as phase images, was coated with fibronectin (50 μg/ml). The fibronectin was transferred from the raised features on the stamp onto a PDMS-coated glass coverslip via micro-contact printing. The gaps between fibronectin islands were blocked using Pluronic F127 to prevent cell adhesion to the non-adhesive areas. The fibronectin forming the circular and the square islands on the PDMS-coated glass coverslips was visualized by immunostaining. Scale bar = 50 μm. (b) Images of MSCs plated on circular or square micropatterns after cultured for 14 days in mixed differentiation medium; these were stained to reveal the presence of lipid (Oil Red O; red) and ALP activity (purple). Scale bar = 50 μm. (c) Percentage of MSCs, as indicated in (b), showing osteogenesis (ALP-positive cells) and adipogenesis (Oil Red O-positive cells). Data are mean ± s.e.m (n = 3 independent experiments). Statistical analysis of data was carried out by the Student’s t-test. *p < 0.05; ***p < 0.001. (d) Fold of Runx2 total fluorescence intensity in the MSCs seeded on circular or square micropatterns after cultured for 7 days in mixed differentiation medium. Data are mean ± s.e.m [n = 27 cells (circle) and 27 cells (square) from 3 independent experiments]. Data were tested for normality and homoscedasticity in SPSS. Statistical analysis of data was carried out by the Student’s t-test. ***p < 0.001.
