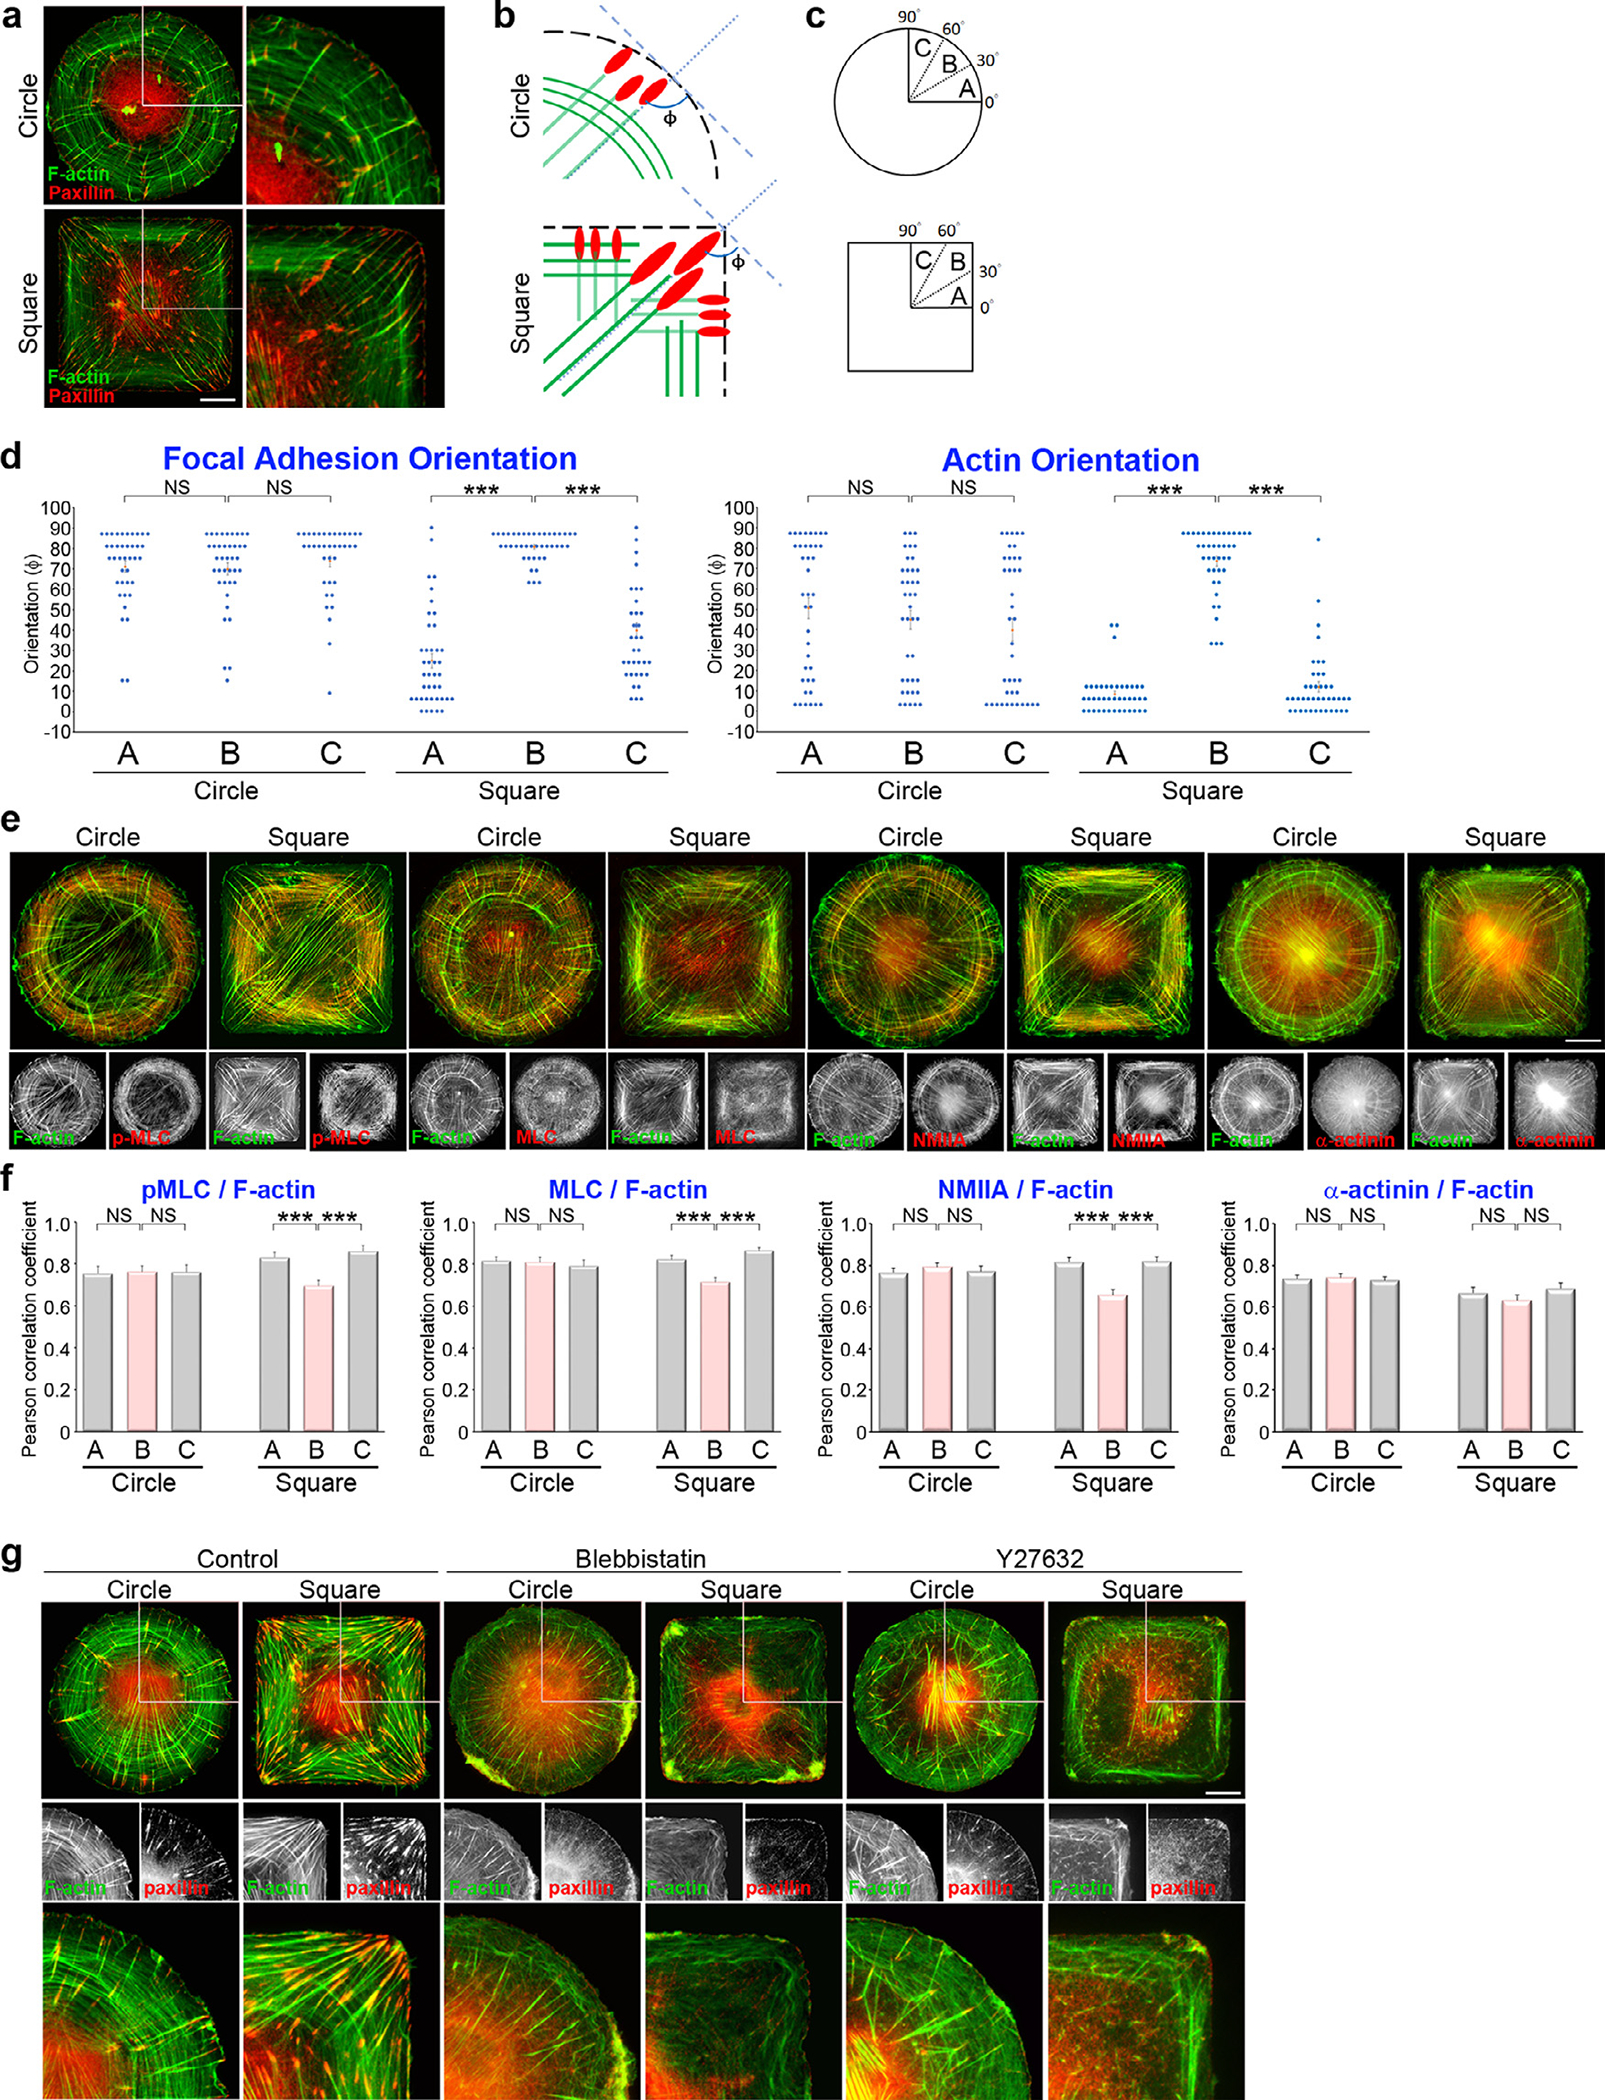
Fig. 3. Geometric cues and myosin-II mediated contractility of transverse fibers guide the alignment of focal adhesions and radial fibers.

(a) Images of immunostained paxillin and phalloidin (to visualize F-actin) in MSCs plated on circular or square micropatterns after cultured for 16 hrs in growth medium. Scale bar, 20 μm. The 53.7 μm × 53.7 μm areas indicated in the left images are magnified on the right. (b) A schematic diagram of the strategy used to determine the orientation of the indicated protein in relation to the cell edge. (c) A schematic diagram of angular sectors used for reporting statistics. (d) Orientation of the paxillin-marked FAs and F-actin in relation to the cell edge vs. angular sector for MSCs plated on circular or square micropatterns after cultured for 16 hrs in growth medium. Data are mean ± s.e.m [F-actin, n = 39 cells (circle) and 41 cells (square); paxillin, n = 39 cells (circle) and 41 cells (square); the analyzed cells were from 3 independent experiments]. Data were tested for normality and homoscedasticity in SPSS. Statistical analysis of data was carried out by one-way ANOVA, followed by the Student’s t-test. *** p < 0.001; NS, no significance. (e) MSCs plated on circular or square micropatterns after cultured for 16 hrs in growth medium; these were immunostained with phalloidin (to localize F-actin; green) and p-MLC (red), MLC (red), NMIIA (red) or α-actinin (red). Scale bar, 20 μm. (f) Values indicate Pearson’s correlation coefficients for the images of F-actin and p-MLC, MLC, NMIIA or α-actinin, as indicated in (e), within the angular sectors of the first quadrant. Data are mean ±s.e.m [phalloidin/p-MLC, n = 40 cells (circle) and 40 cells (square); phalloidin/MLC, n = 40 cells (circle) and 49 cells (square); phalloidin/NMIIA, n = 46 cells (circle) and 46 cells (square); phalloidin/α-actinin, n = 45 cells (circle) and 45 cells (square); the analyzed cells were from 3 independent experiments]. Data were tested for normality and homoscedasticity in SPSS. Statistical analysis of data was carried out by one-way ANOVA, followed by the Student’s t-test. ***p < 0.001; NS, no significance. (g) MSCs cultured for 16 hrs in growth medium were treated with DMSO (control), blebbistatin (50 μM, 2 h) or Y27632 (10 μM, 1h); these were immunostained for paxillin (to localize FAs; red) and phalloidin (to localize F-actin; green). Scale bar, 20 μm. The 53.7 μm × 53.7 μm areas indicated in the top images are magnified in the bottom.
